

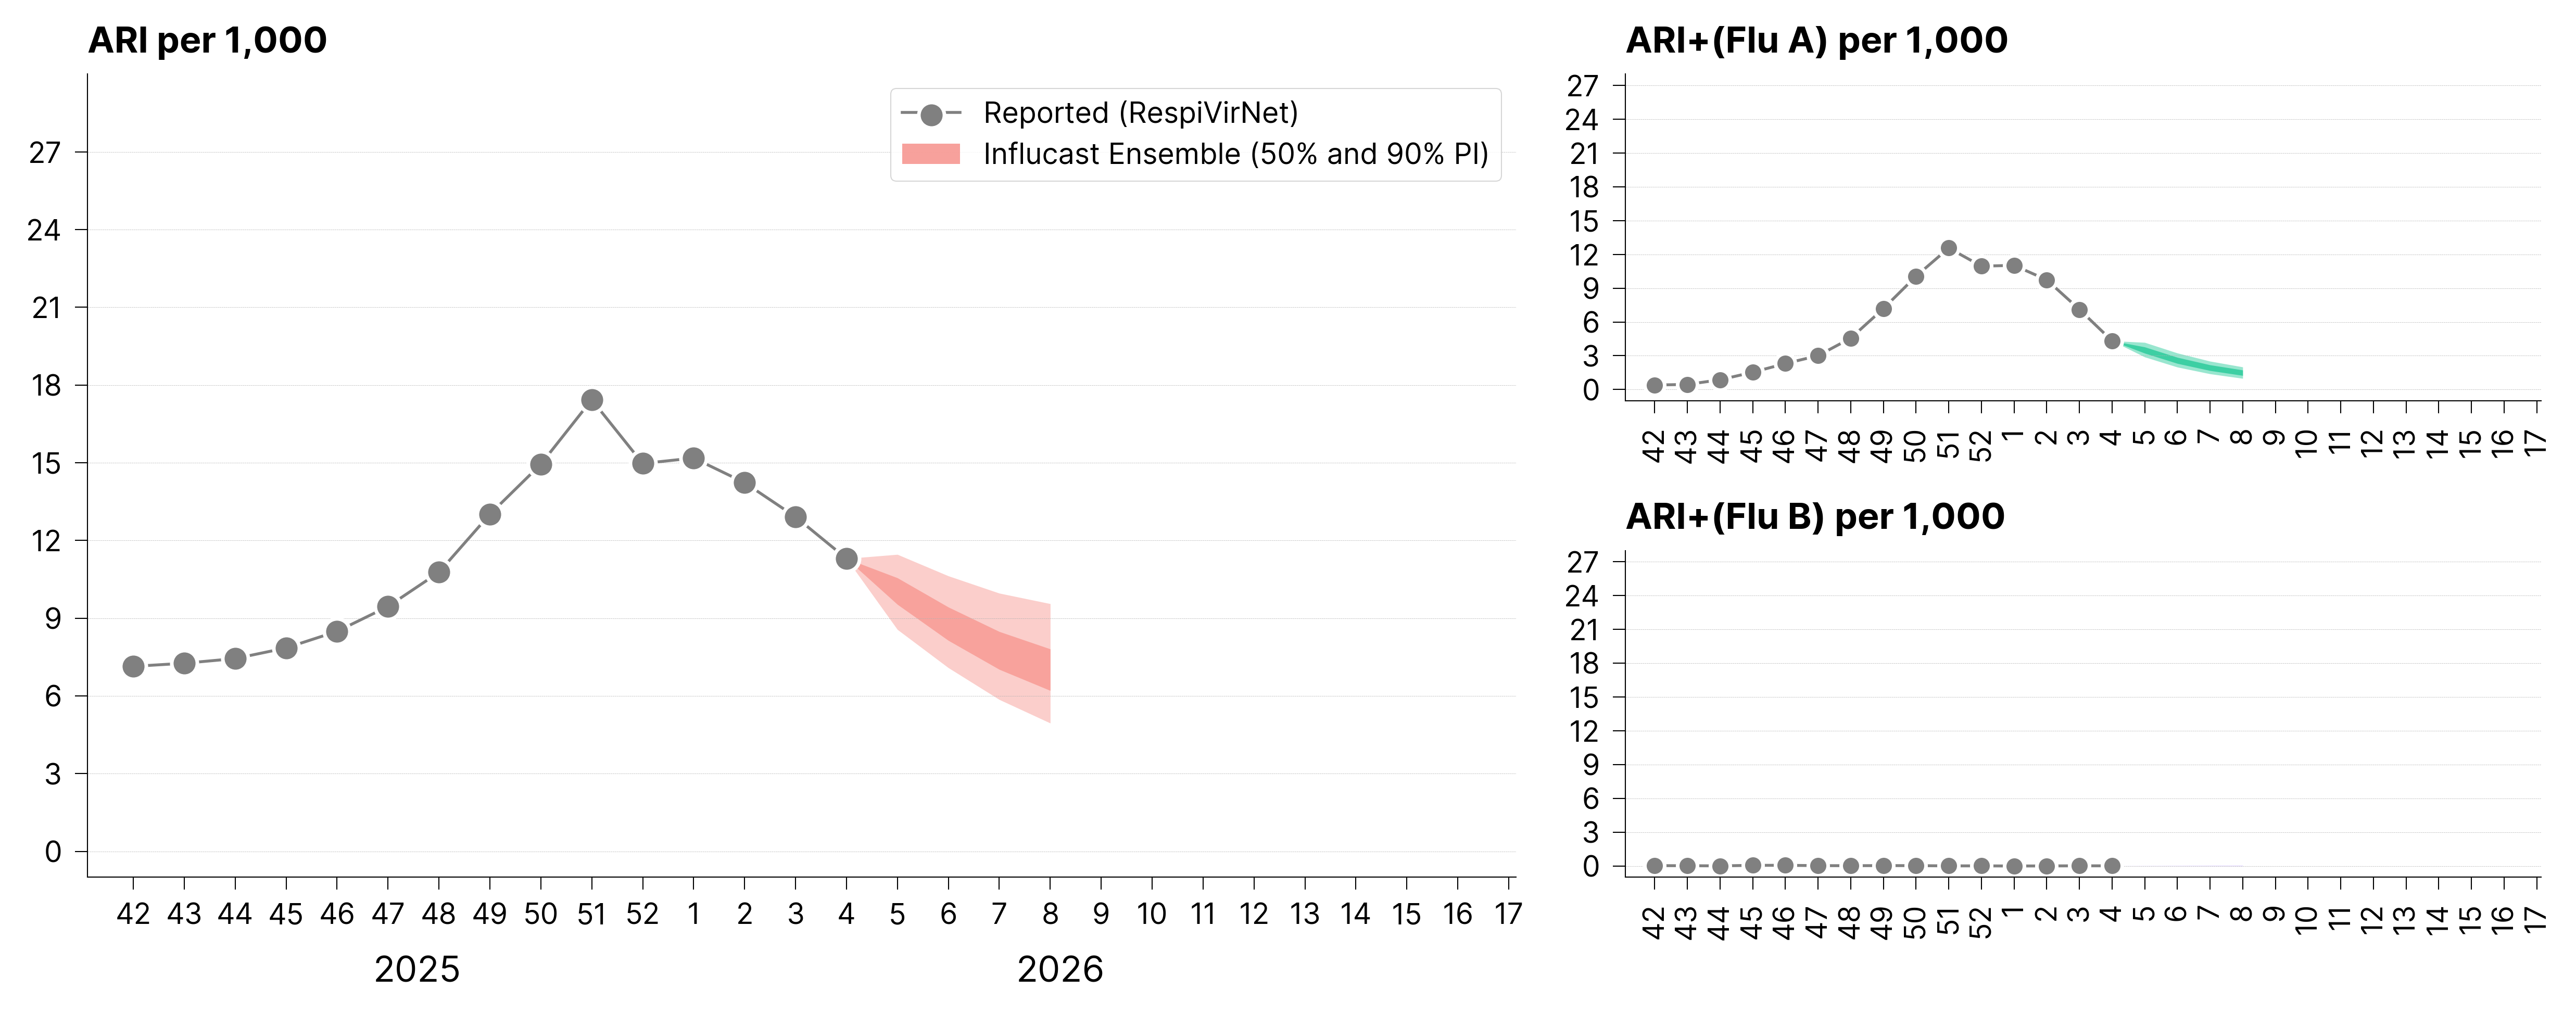
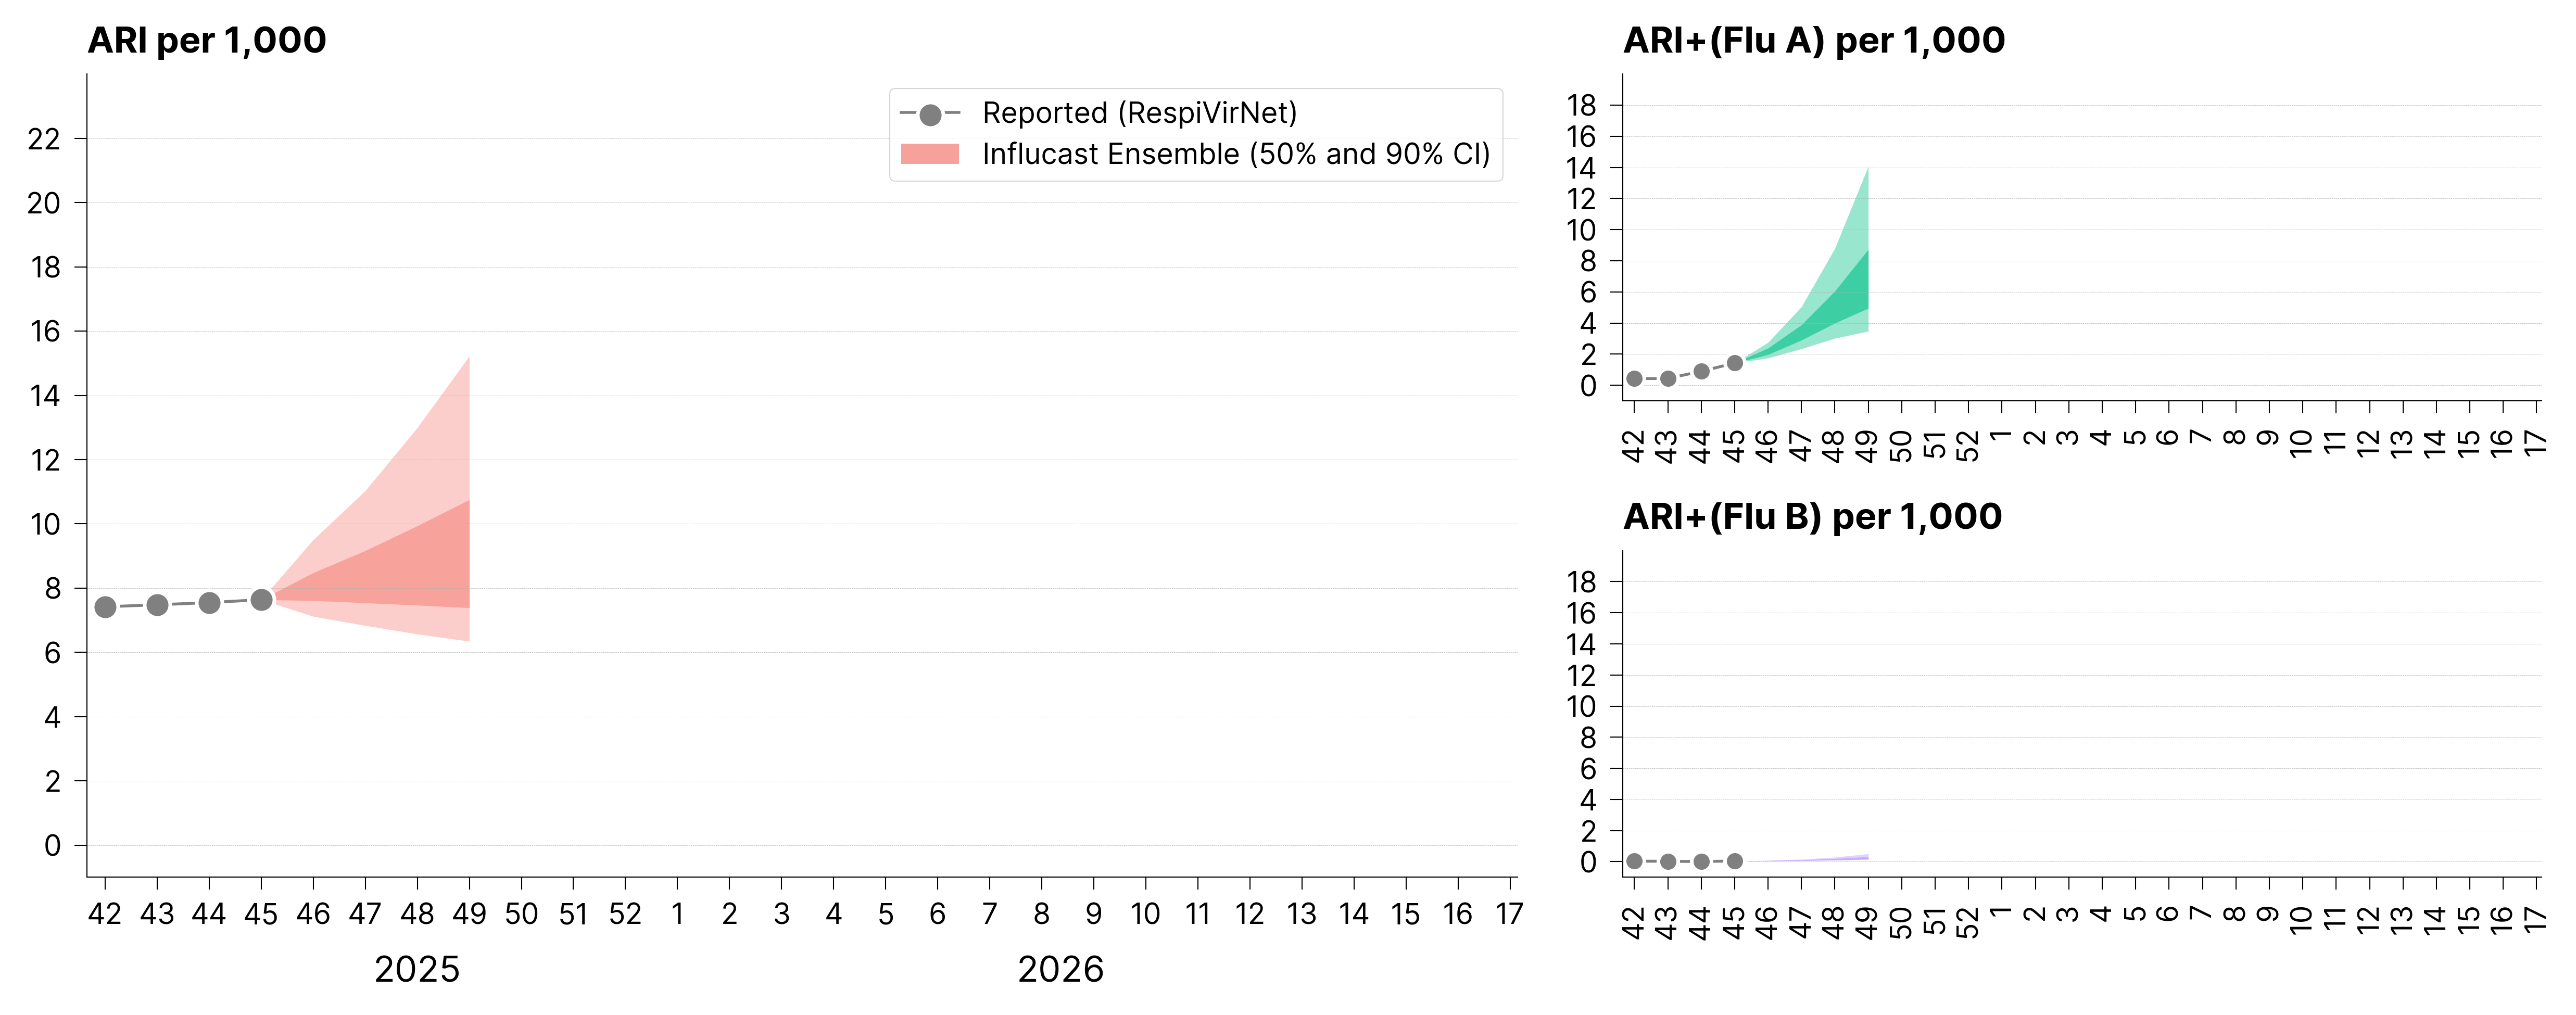
At the national level, the latest Influcast forecasts indicate a decreasing trend in ARI incidence over the next four weeks.
Specifically, at the national level we estimate:- Week 05, 2026: 10.1 (95% PI: 8.6 - 11.5) ARI per 1,000
- Week 06, 2026: 8.8 (95% PI: 7.1 - 10.6) ARI per 1,000
- Week 07, 2026: 7.7 (95% PI: 5.9 - 10.0) ARI per 1,000
- Week 08, 2026: 6.9 (95% PI: 4.9 - 9.6) ARI per 1,000
Where PI = Prediction Interval.
Regarding virological targets, a similar trend in ARI activity associated with influenza A is expected in the coming weeks. Specifically, for ARI+(A) a decreasing trend is observed over the next four weeks, while influenza B activity remains at minimal levels.
For more details, explore the results on the dashboard.
We thank the teams participating in the 2025/26 season:
- Center for Computational Social Science and Human Dynamics - Trento
- CoMuNe Lab, University of Padova
- Networks in Disease Ecology Lab, University of Padova
- Queen Mary University of London
- Complex Systems Laboratory, Department of Electronics and Telecommunications, Politecnico di Torino
- Fondazione ISI
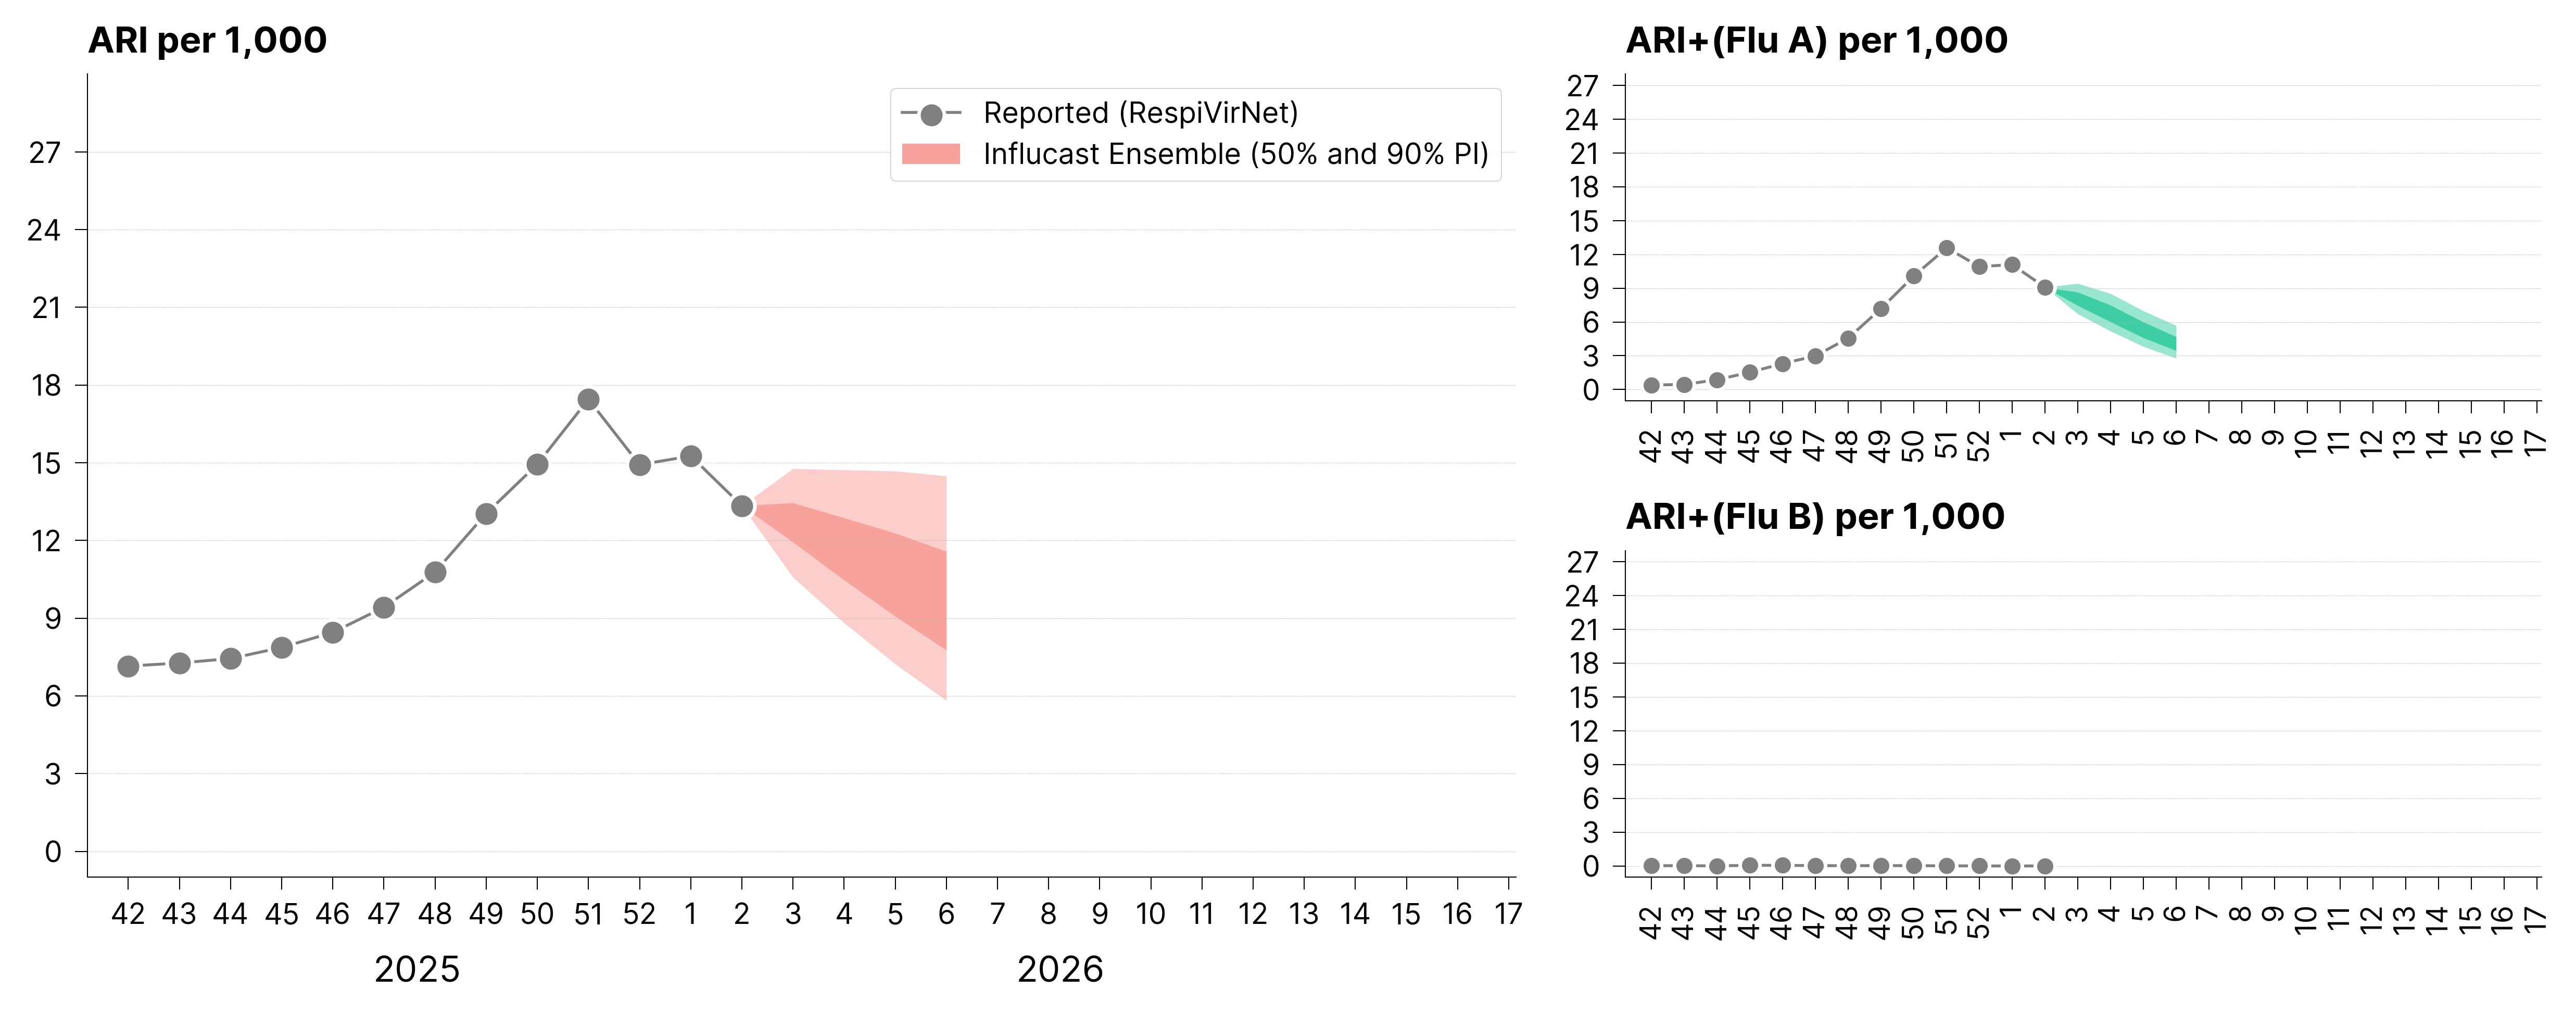
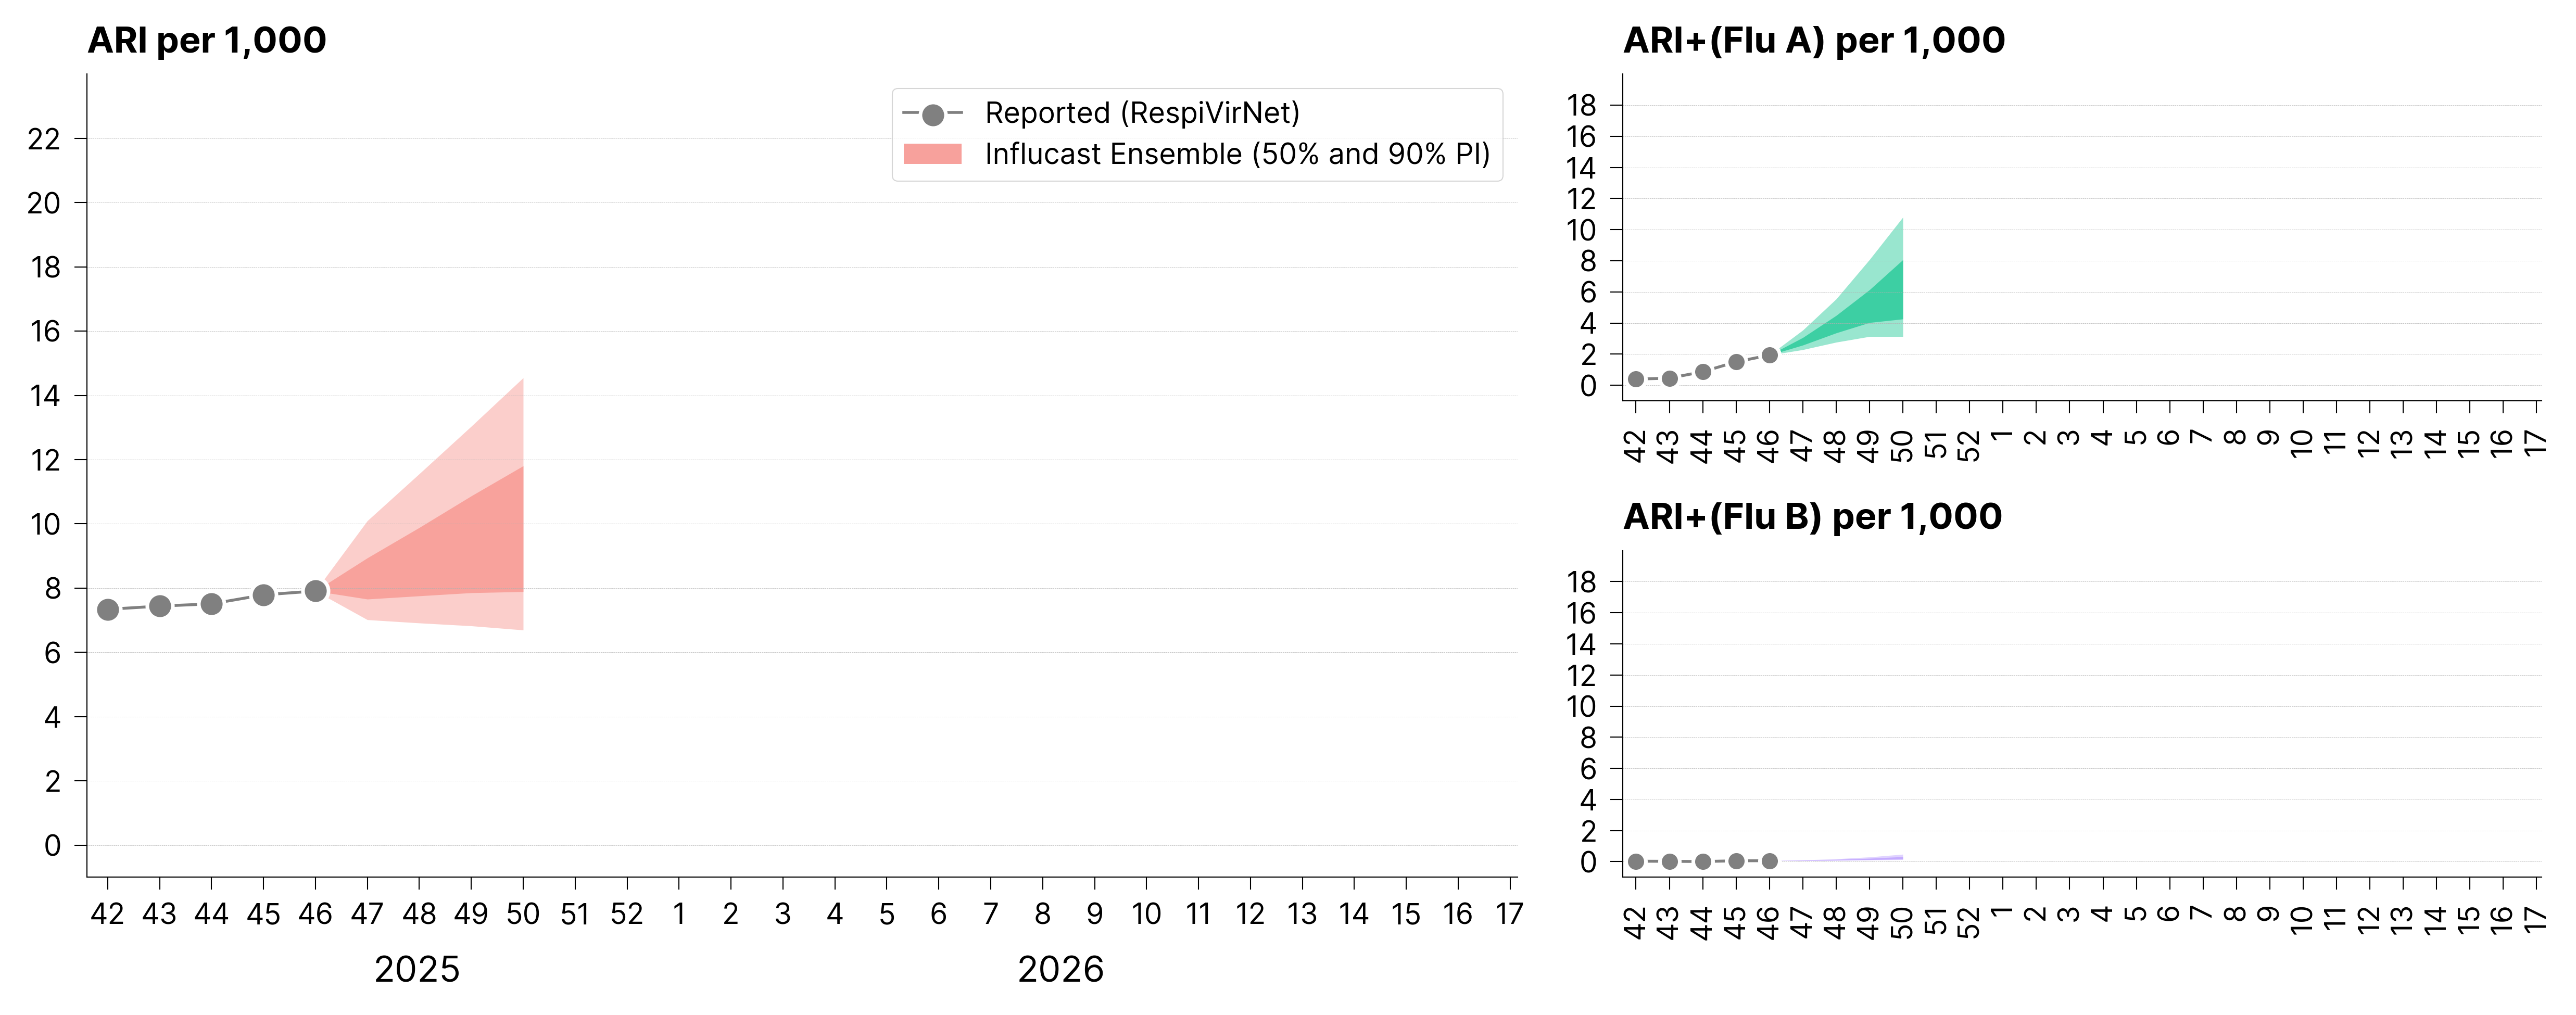
At the national level, the latest Influcast forecasts indicate a decreasing trend in ARI incidence over the next four weeks.
Specifically, at the national level we estimate:- Week 03, 2026: 12.6 (95% PI: 10.6 - 14.8) ARI per 1,000
- Week 04, 2026: 11.5 (95% PI: 8.8 - 14.7) ARI per 1,000
- Week 05, 2026: 10.4 (95% PI: 7.2 - 14.7) ARI per 1,000
- Week 06, 2026: 9.3 (95% PI: 5.8 - 14.5) ARI per 1,000
Where PI = Prediction Interval.
Regarding virological targets, a similar trend in ARI activity associated with influenza A is expected in the coming weeks. Specifically, for ARI+(A) a decreasing trend is observed over the next four weeks, while influenza B activity remains at minimal levels.
For more details, explore the results on the dashboard.
We thank the teams participating in the 2025/26 season:
- Center for Computational Social Science and Human Dynamics - Trento
- CoMuNe Lab, University of Padova
- Networks in Disease Ecology Lab, University of Padova
- Queen Mary University of London
- Complex Systems Laboratory, Department of Electronics and Telecommunications, Politecnico di Torino
- Fondazione ISI
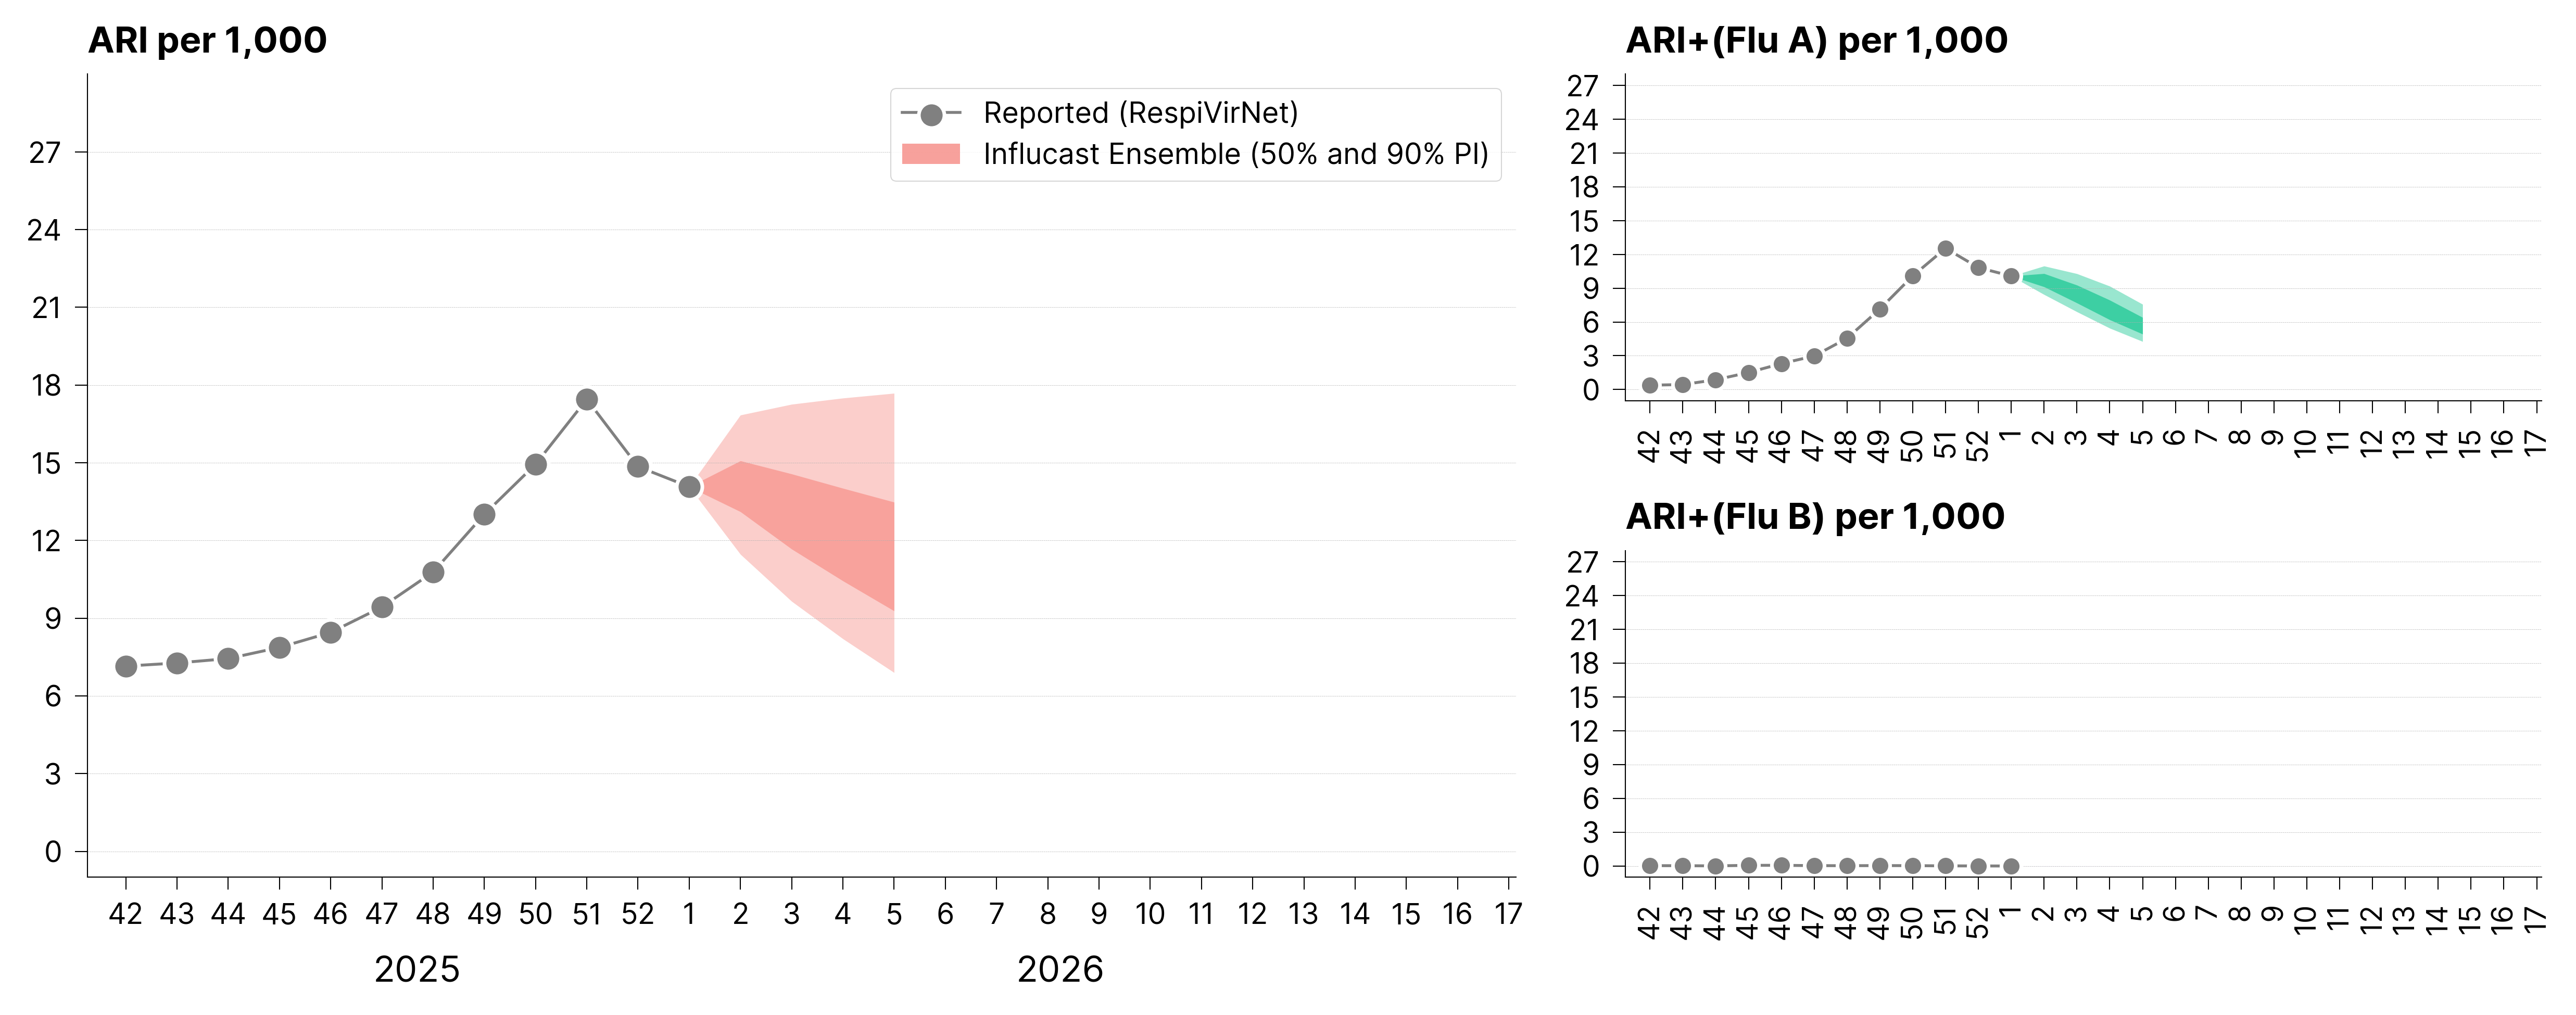
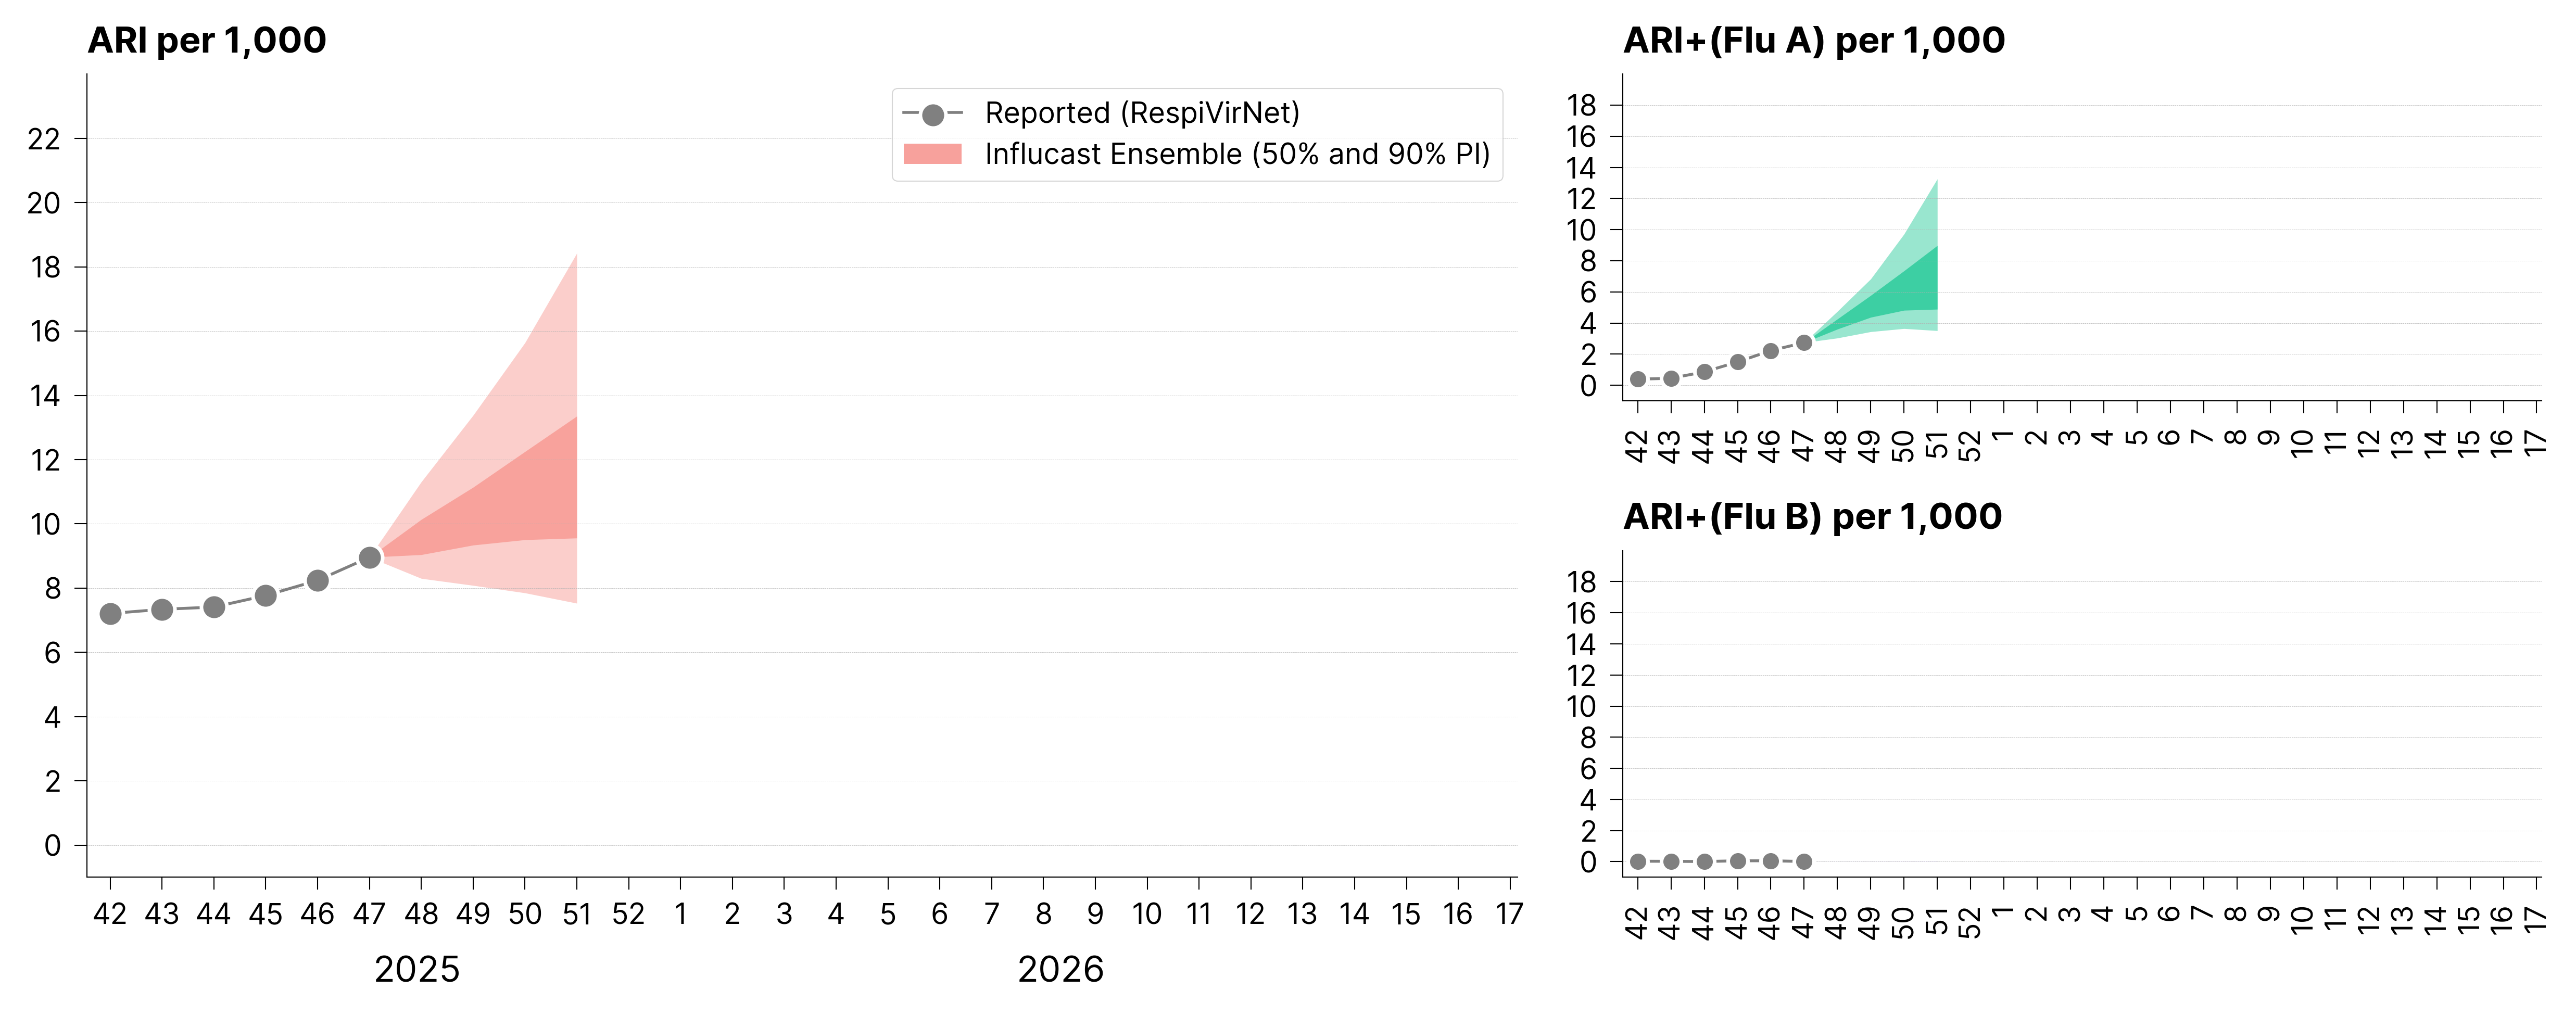
At the national level, the latest Influcast forecasts indicate a stable/decreasing trend in ARI incidence over the next four weeks.
In particular, at the national level it is estimated:- Week 02, 2026: 13.9 (95% PI: 11.5 - 16.8) ARI per 1,000
- Week 03, 2026: 13.0 (95% PI: 9.7 - 17.3) ARI per 1,000
- Week 04, 2026: 12.0 (95% PI: 8.2 - 17.5) ARI per 1,000
- Week 05, 2026: 11.1 (95% PI: 6.9 - 17.7) ARI per 1,000
Where PI = Prediction Interval.
Regarding virological targets, a similar trend in influenza A-associated ARI activity is expected in the coming weeks. In particular, for ARI+(A) a decreasing trend is observed over the next four weeks, while influenza B activity remains at minimal levels.
For more details, explore the results on the dashboard.
We thank the teams participating in the 2025/26 season:
- Center for Computational Social Science and Human Dynamics - Trento
- CoMuNe Lab, University of Padua
- Networks in Disease Ecology Lab, University of Padua
- Queen Mary University of London
- Complex Systems Laboratory, Department of Electronics and Telecommunications, Polytechnic University of Turin
- Fondazione ISI
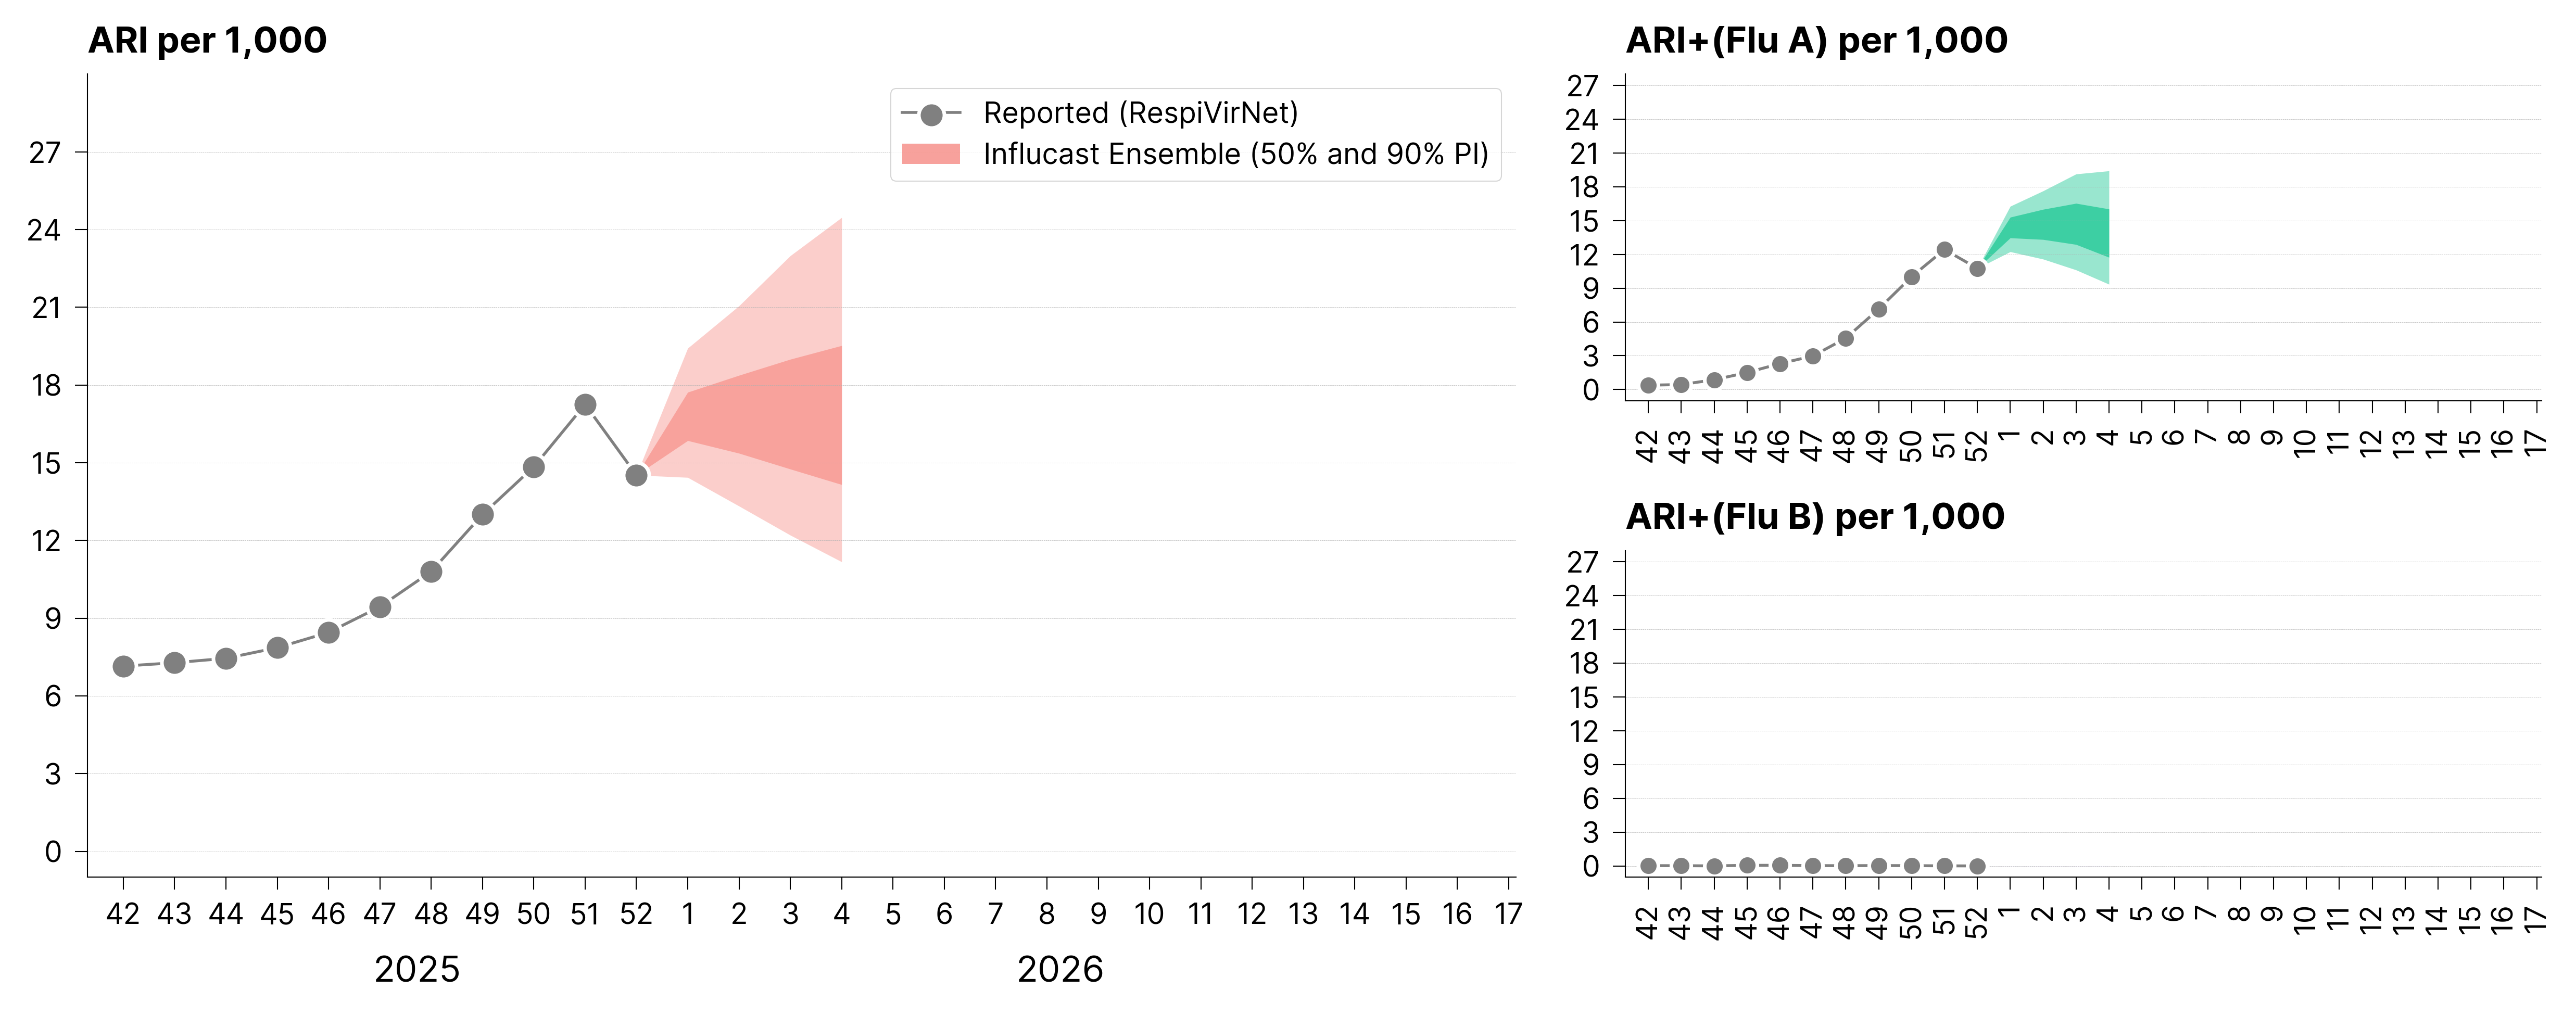
At the national level, the latest Influcast forecasts indicate an overall stable trend in ARI incidence over the next four weeks, suggesting a possible imminent attainment of the seasonal peak in cases. However, it is worth noting that the most recent data reported in the RespiVirNet update from the Istituto Superiore di Sanità (week 52 of 2025) show a national ARI incidence of 14.5 cases per 1,000 assisted individuals, marking a clear slowdown compared to the growth observed in previous weeks. This value may nevertheless be influenced by a change in reporting trends associated with the recently concluded Christmas holidays and may therefore not reflect a genuine decrease in incidence. It is also plausible that the two phenomena—holiday-related effects and a real slowdown in cases—partially overlap. This feature of the data may have negatively affected the calibration of some models. At the individual model level, a marked heterogeneity is observed: some models project a further increase in cases in the coming weeks, while others indicate a slowdown. For this reason as well, the ensemble forecast appears substantially “flat” in the short term, with a widening uncertainty cone. Caution is therefore recommended when interpreting both the latest RespiVirNet data and the associated forecasts.
In particular, at the national level, the following estimates are reported:- Week 01, 2026: 16.8 (95% PI: 14.4 - 19.4) ARI per 1,000
- Week 02, 2026: 16.8 (95% PI: 13.3 - 21.1) ARI per 1,000
- Week 03, 2026: 16.8 (95% PI: 12.2 - 23.0) ARI per 1,000
- Week 04, 2026: 16.7 (95% PI: 11.2 - 24.5) ARI per 1,000
Where PI = Prediction Interval.
Regarding virological targets, a similar trend is expected for ARI activity associated with influenza A in the coming weeks. Specifically, ARI+(A) is projected to remain overall stable over the next four weeks, while influenza B activity remains at minimal levels. It is important to note that, by definition, ARI+(A) depends on ARI; consequently, all the issues highlighted above for ARI may also affect the virological targets.
For further details, explore the results on the dashboard.
We thank the teams participating in the 2025/26 season:
- Center for Computational Social Science and Human Dynamics - Trento
- CoMuNe Lab, University of Padua
- Networks in Disease Ecology Lab, University of Padua
- Queen Mary University of London
- Complex Systems Laboratory, Department of Electronics and Telecommunications, Politecnico di Torino
- ISI Foundation
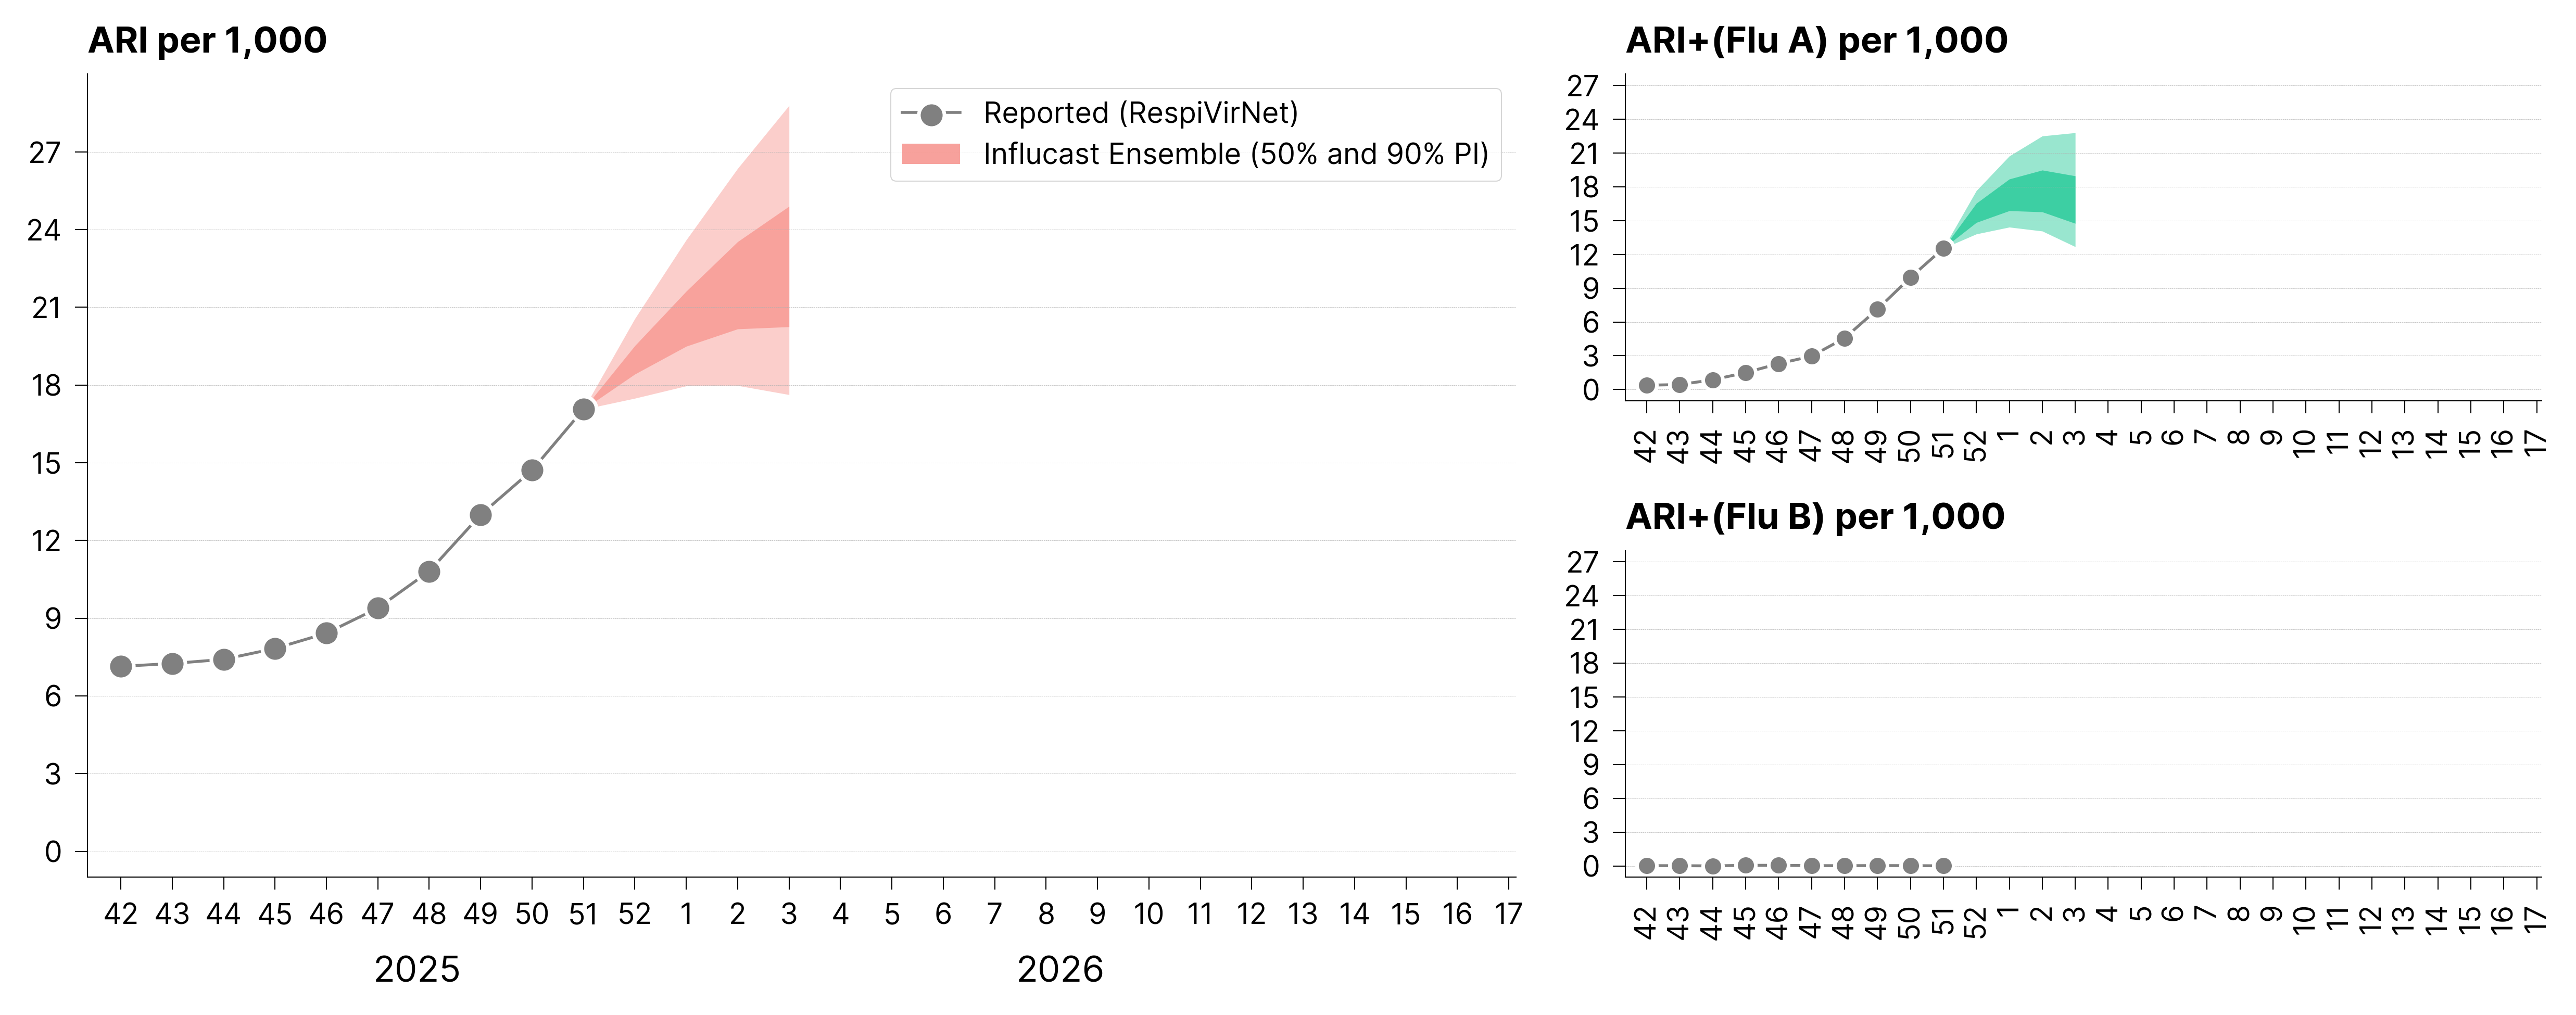
The RespiVirNet update from the Istituto Superiore di Sanità for week 51 reports a national ARI incidence of 17.1 cases per 1,000 individuals under surveillance, further increasing compared to the value reported in the previous week (14.7 per 1,000). In line with this trend, the latest Influcast forecasts indicate a further increase in ARI incidence in Italy over the next 4 weeks.
In particular, at the national level, it is estimated:- Week 51, 2025: 18.9 (95% PI: 17.5 - 20.6) ARI per 1,000
- Week 52, 2025: 20.4 (95% PI: 18.0 - 23.6) ARI per 1,000
- Week 01, 2026: 21.7 (95% PI: 18.0 - 26.4) ARI per 1,000
- Week 02, 2026: 22.8 (95% PI: 17.6 - 28.8) ARI per 1,000
Where PI = Prediction Interval. In the majority of regions, a similar increase in ARI incidence is expected in the coming weeks, with a more pronounced growth in the Center and South of the country.
Regarding virological targets, a further increase in influenza A–associated ARI activity is expected in the coming weeks. For both ARI and ARI+(A), a possible slowdown in the growth trend is observed at the beginning of the new year, suggesting a potential approach to the peak of infections. However, due to the high uncertainty associated with the holiday period—which generally entails significant changes in population contact patterns (e.g., school closures and large indoor gatherings)—caution is advised in interpreting this signal. It is also noted that, as shown by RespiVirNet virological surveillance data, the growth of ARI+(A) is driven by the rapid spread of influenza A/H3N2 viruses (subclade K), while influenza B activity remains at minimal levels.
For further details, explore the results on the dashboard.
We thank the teams participating in the 2025/26 season:
- Center for Computational Social Science and Human Dynamics – Trento
- CoMuNe Lab, University of Padua
- Networks in Disease Ecology Lab, University of Padua
- Queen Mary University of London
- Complex Systems Laboratory, Department of Electronics and Telecommunications, Politecnico di Torino
- Fondazione ISI
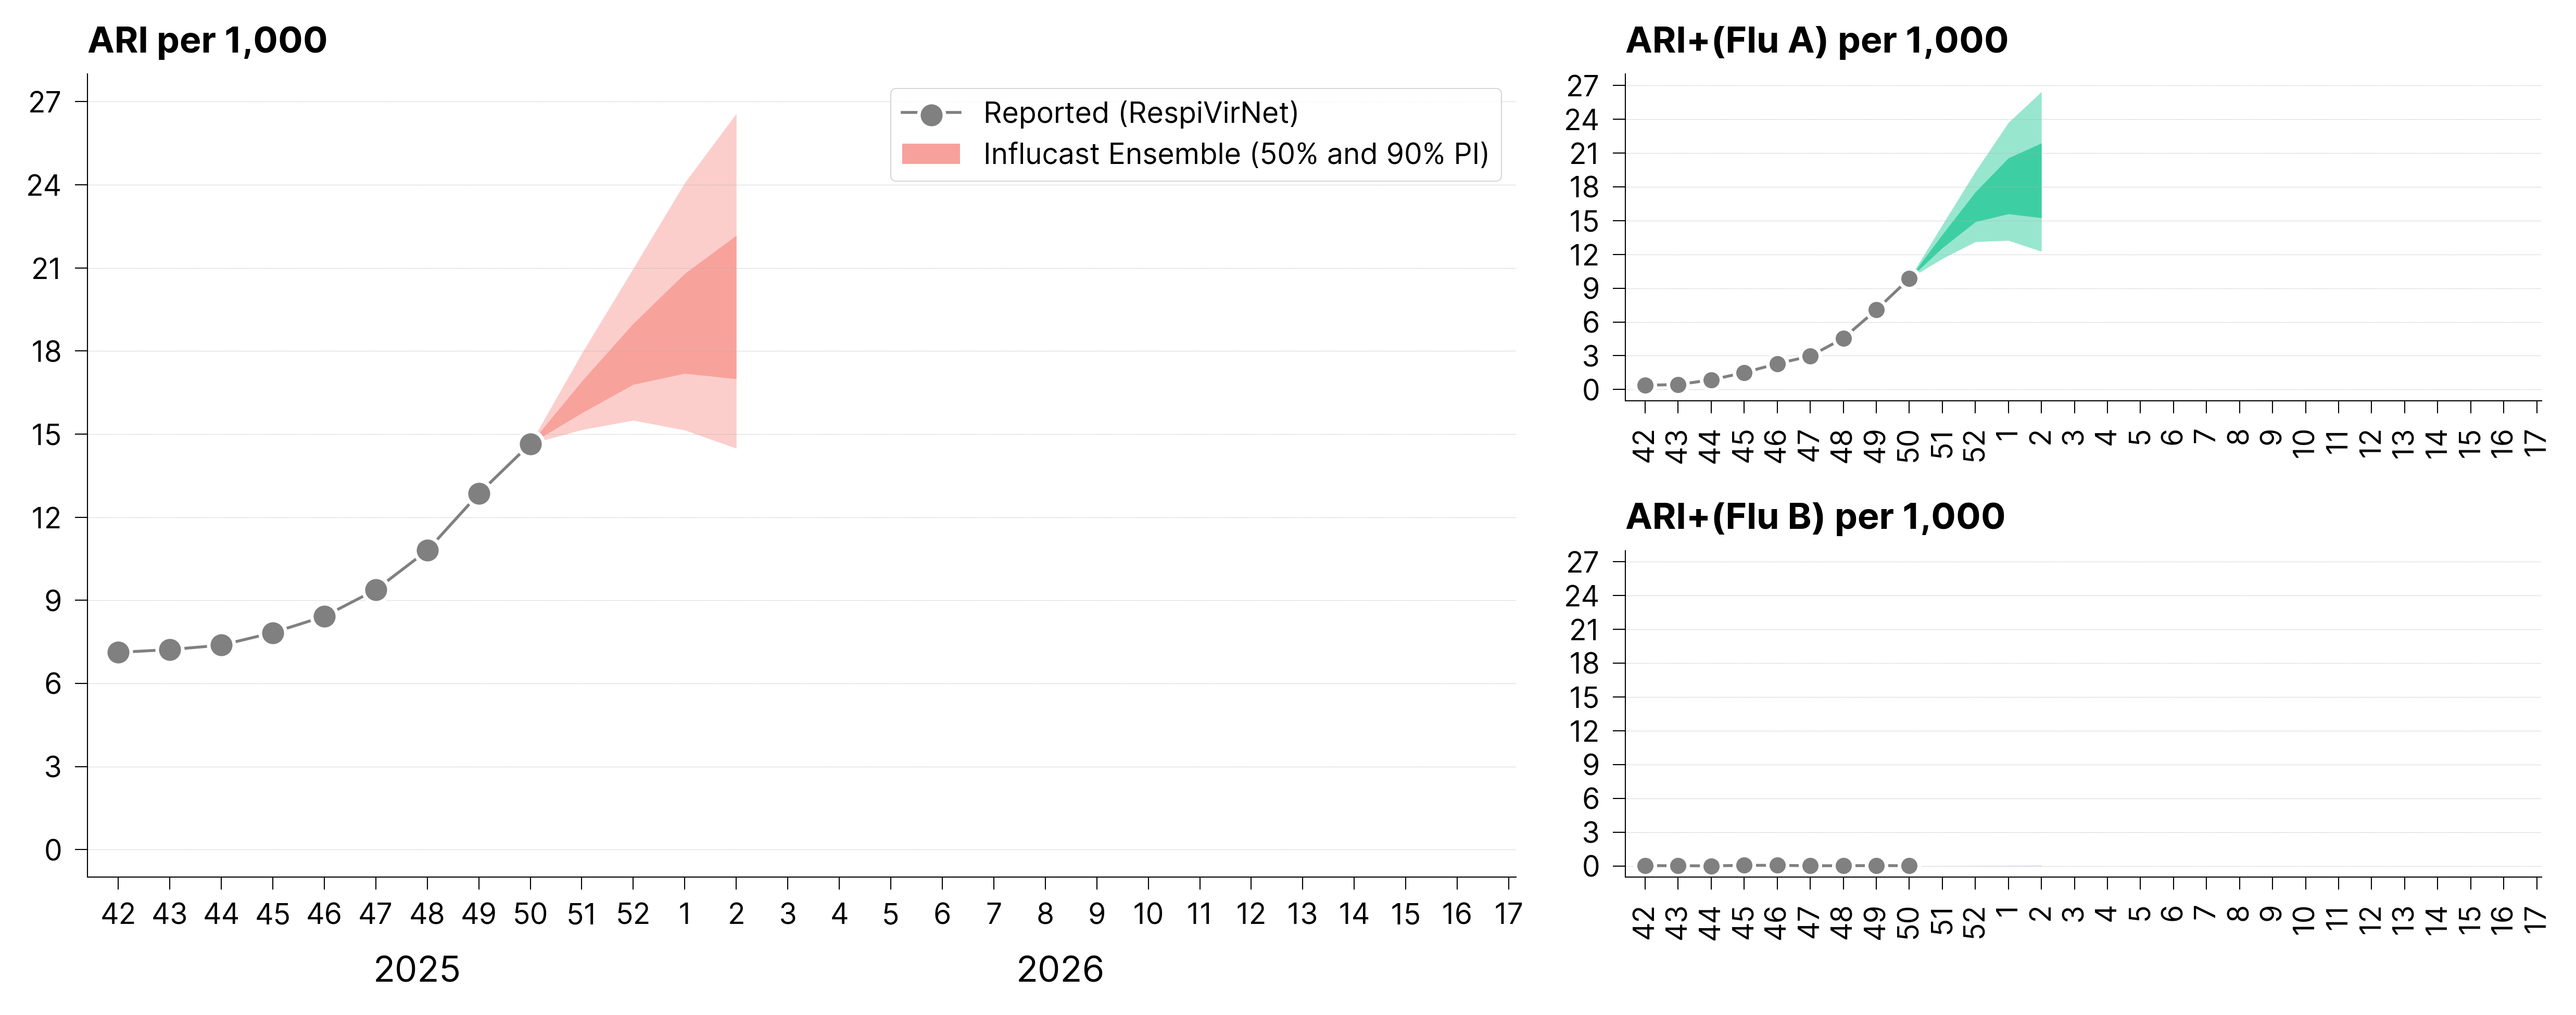
The RespiVirNet update from the Istituto Superiore di Sanità for week 50 reports a national ARI incidence of 14.7 cases per 1,000 individuals under surveillance, increasing compared to the value reported in the previous week (12.8 per 1,000). In line with this trend, the latest Influcast forecasts indicate a further increase in ARI incidence in Italy over the next 4 weeks.
In particular, at the national level, it is estimated:- Week 51, 2025: 16.3 (95% PI: 15.2 – 17.9) ARI per 1,000
- Week 52, 2025: 17.8 (95% PI: 15.5 – 21.0) ARI per 1,000
- Week 01, 2026: 18.9 (95% PI: 15.1 – 24.1) ARI per 1,000
- Week 02, 2026: 18.9 (95% PI: 15.1 – 24.1) ARI per 1,000
Where PI = Prediction Interval. In the majority of regions, a similar increase in ARI incidence is expected in the coming weeks, with a more pronounced growth in the North and Center of the country.
Regarding virological targets, a further increase in influenza A–associated ARI activity is expected in the coming weeks. For both ARI and ARI+(A), a possible slowdown in the growth trend is observed at the beginning of the new year, suggesting a potential approach to the peak of infections. However, due to the high uncertainty associated with the upcoming holiday period—which generally entails significant changes in population contact patterns (e.g., school closures and large indoor gatherings)—caution is advised in interpreting this signal. It is also noted that, as shown by RespiVirNet virological surveillance data, the growth of ARI+(A) is driven by the rapid spread of influenza A/H3N2 viruses (subclade K), while influenza B activity remains at minimal levels.
For further details, explore the results on the dashboard.
We thank the teams participating in the 2025/26 season:
- Center for Computational Social Science and Human Dynamics – Trento
- CoMuNe Lab, University of Padua
- Networks in Disease Ecology Lab, University of Padua
- Queen Mary University of London
- Complex Systems Laboratory, Department of Electronics and Telecommunications, Politecnico di Torino
- Fondazione ISI
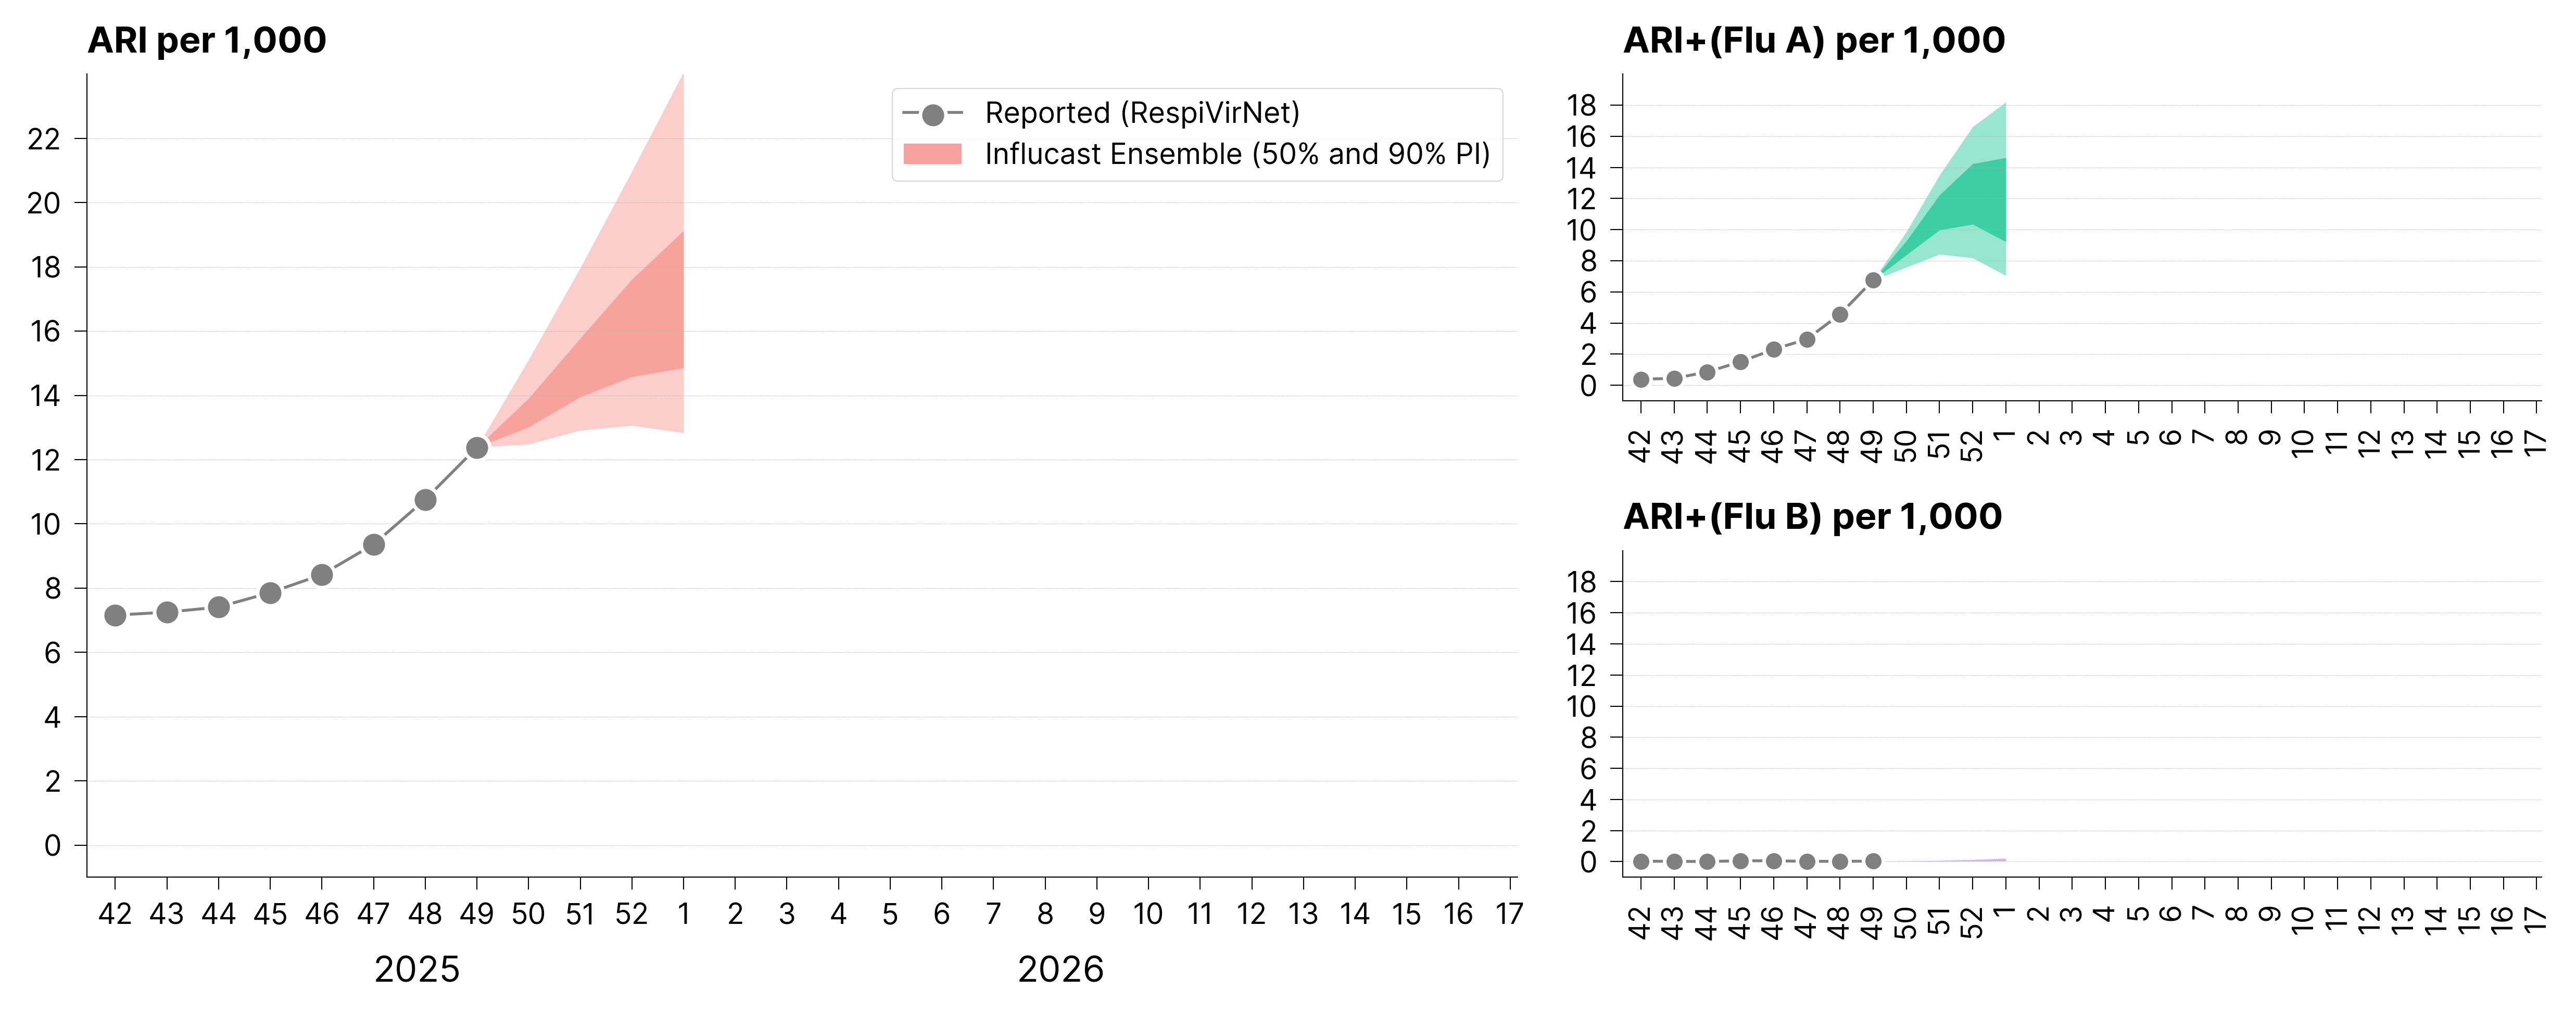
The latest RespiVirNet update from the Istituto Superiore di Sanità reports a national ARI incidence of 12.4 cases per 1,000 assisted individuals, increasing compared with the value reported in the previous week (10.8 per 1,000). Consistent with this trend, the latest Influcast forecasts indicate a further increase in ARI incidence in Italy over the next four weeks.
In particular, at the national level, the following estimates are reported:- Week 50, 2025: 13.4 (95% PI: 12.5 – 15.1) ARI per 1,000
- Week 51, 2025: 14.8 (95% PI: 12.9 – 18.0) ARI per 1,000
- Week 52, 2025: 16.1 (95% PI: 13.1 – 21.0) ARI per 1,000
- Week 01, 2026: 16.9 (95% PI: 12.8 – 24.1) ARI per 1,000
Where PI = Prediction Interval. In most regions, a similar increase in ARI incidence is expected over the coming weeks, with a more pronounced growth in Northern and Central Italy.
Regarding virological targets, a further increase in ARI activity associated with influenza A is expected in the coming weeks. A possible slowdown in ARI+(A) incidence is observed toward the end of the year. However, due to the high uncertainty associated with the upcoming holiday period, which typically leads to significant changes in population contact patterns (e.g. school closures and large indoor gatherings), it is not possible to determine with certainty whether this trend represents a clear signal that the peak has been reached. Furthermore, as shown by data from the RespiVirNet virological surveillance system, the growth of ARI+(A) is potentially driven by the rapid spread of the influenza A/H3N2 strain, while influenza B activity remains at minimal levels.
For further details, explore the results on the dashboard.
We thank the teams participating in the 2025/26 season:
- Center for Computational Social Science and Human Dynamics – Trento
- CoMuNe Lab, University of Padua
- Networks in Disease Ecology Lab, University of Padua
- Queen Mary University of London
- Complex Systems Laboratory, Department of Electronics and Telecommunications, Politecnico di Torino
- Fondazione ISI
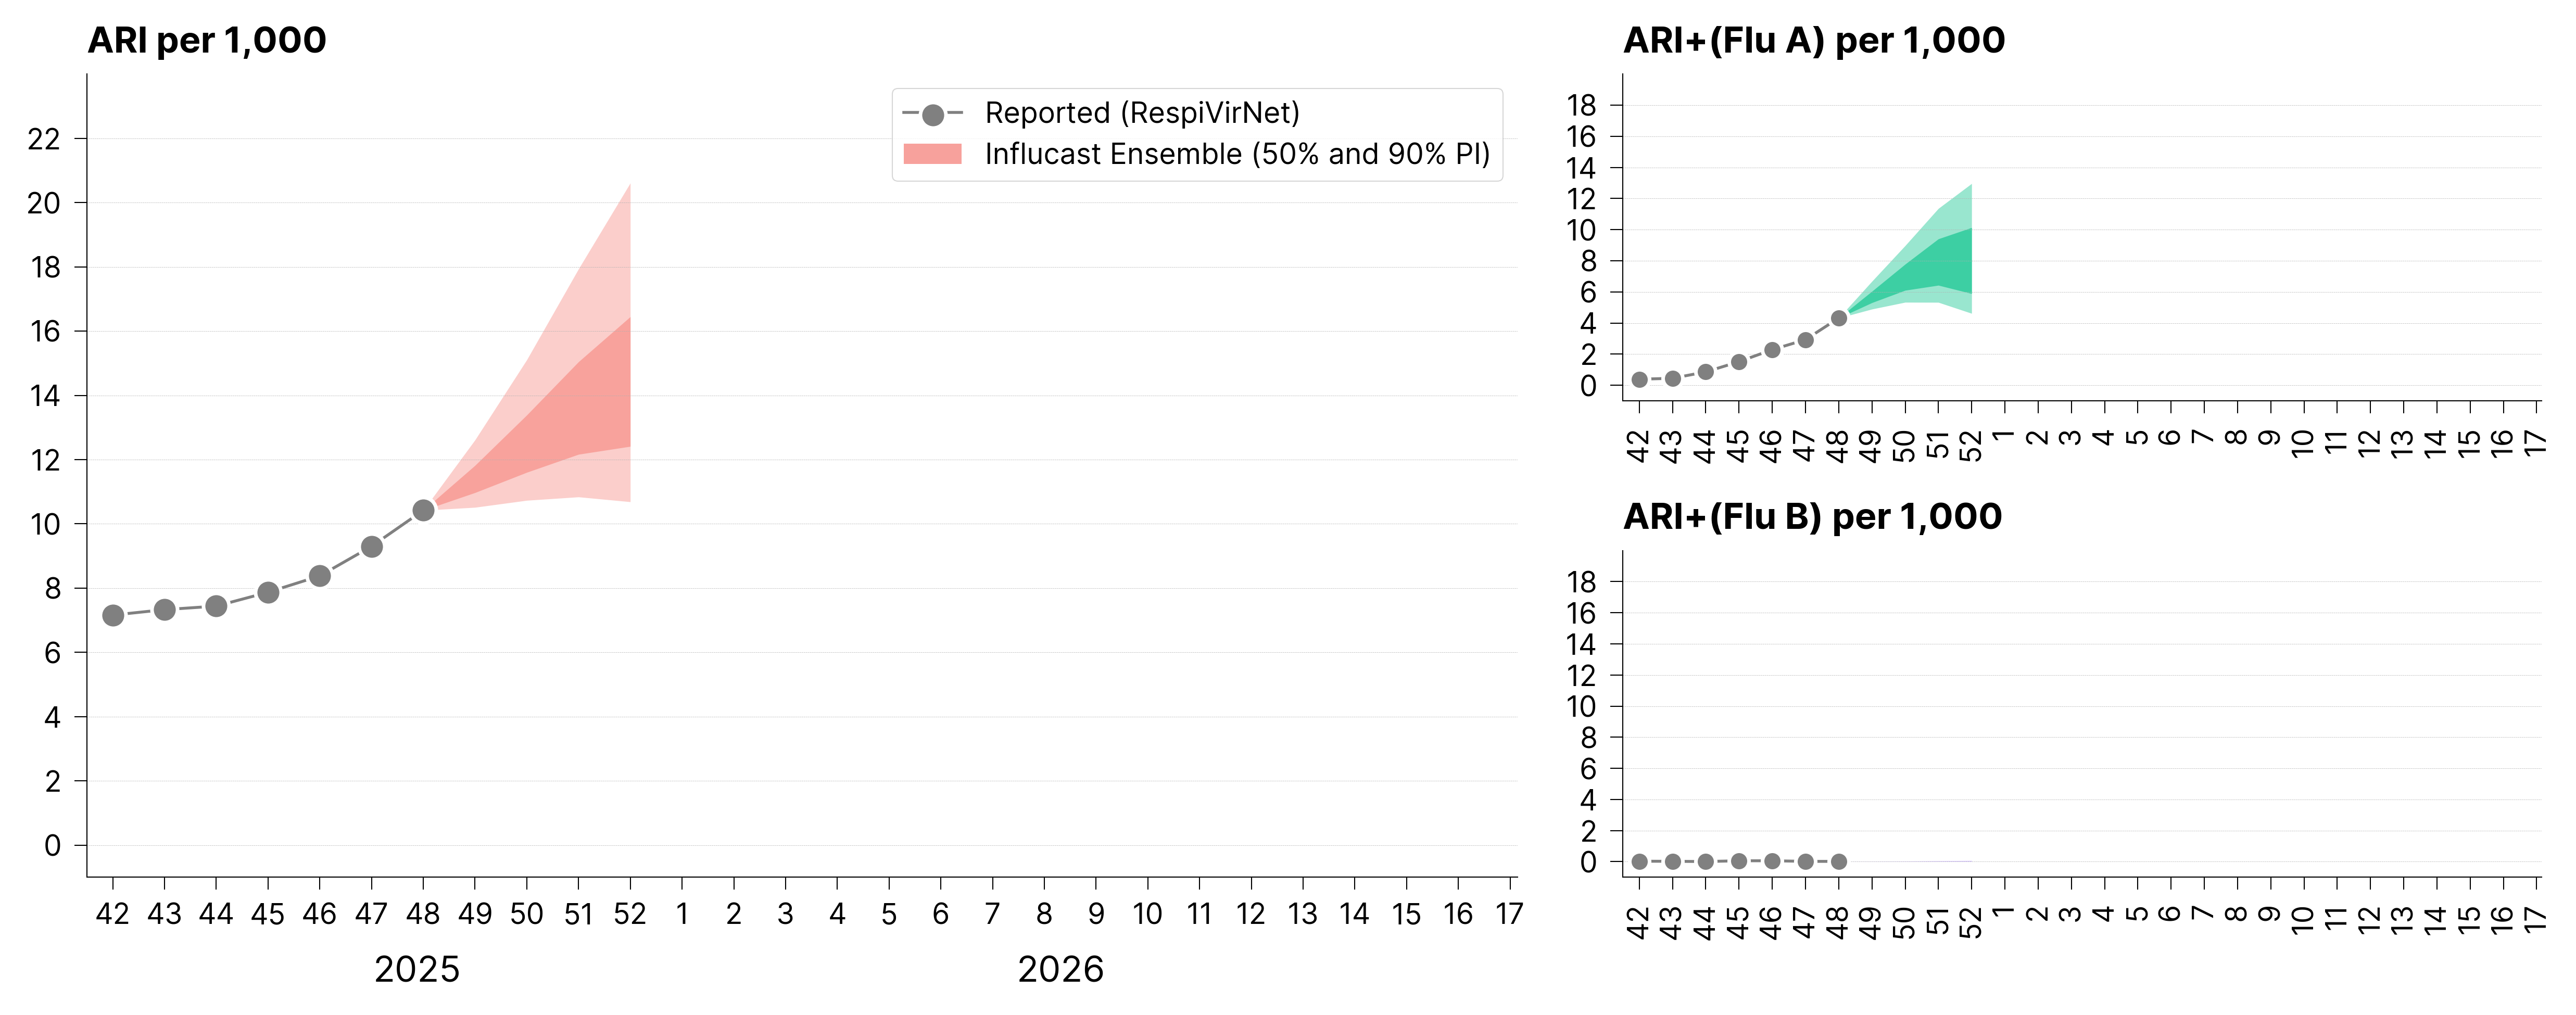
At the national level, a sharp increase in the incidence of ARI cases is expected in the coming weeks, following the trend of recent weeks.
In particular, at the national level it is estimated:- Week 49, 2025: 10.5–12.6 ARI per 1,000
- Week 50, 2025: 10.7–15.1 ARI per 1,000
- Week 51, 2025: 10.8–17.9 ARI per 1,000
- Week 52, 2025: 10.7–20.6 ARI per 1,000
Note the high uncertainty, highlighted by the wide intervals, especially at longer horizons. In all regions, an increase in ARI incidence is expected in the coming weeks, with stronger growth in the Northeast and Central areas.
Consistent with forecasts from recent weeks, a significant increase in ARI activity associated with influenza A is expected in the coming weeks, while influenza B activity remains at minimal levels. The growth in ARI+A may be driven by the rapid spread of the influenza A/H3N2 strain, as suggested by the data reported in the RespiVirNet virological surveillance.
For more details, explore the results on the dashboard.
We thank the teams participating in the 2025/26 season:
- Center for Computational Social Science and Human Dynamics - Trento
- CoMuNe Lab, University of Padua
- Networks in Disease Ecology Lab, University of Padua
- Queen Mary University of London
- Complex Systems Laboratory, Department of Electronics and Telecommunications, Polytechnic University of Turin
- Fondazione ISI
Short-term forecasts show an increase in ARI case incidence in the coming weeks, marking a shift compared to previous weeks across the peninsula.
In particular, at the national level it is estimated:- Week 48, 2025: 8.3 - 11.3 ARI per 1,000
- Week 49, 2025: 8.1 - 13.4 ARI per 1,000
- Week 50, 2025: 7.9 - 15.6 ARI per 1,000
- Week 51, 2025: 7.5 - 18.4 ARI per 1,000
Note the high uncertainty, highlighted by the wide intervals—especially at longer horizons—linked to the start of the season and the limited amount of data available. An increase in ARI incidence is expected in all regions over the coming weeks, with stronger growth in the Northeast, Center, and South.
Consistent with forecasts from previous weeks, we highlight a significant increase in influenza A–associated ARI activity in the coming weeks, while influenza B activity remains at minimal levels. The growth in ARI+A is potentially driven by the rapid spread of the influenza A/H3N2 strain, as shown by the data reported in the RespiVirNet virological surveillance.
For more details, explore the results on the dashboard.
We thank the teams participating in the 2025/26 season:
- Center for Computational Social Science and Human Dynamics - Trento
- CoMuNe Lab, University of Padua
- Networks in Disease Ecology Lab, University of Padua
- Queen Mary University of London
- Complex Systems Laboratory, Department of Electronics and Telecommunications, Politecnico di Torino
- ISI Foundation
The slow rise in ARI cases across the country continues. Short-term ensemble forecasts for week 45 indicate a gradual yet sustained increase in ARI cases at the national level.
In particular, the estimates are:- Week 47, 2025: 7.0 – 10.1 ARI per 1,000
- Week 48, 2025: 6.9 – 11.6 ARI per 1,000
- Week 49, 2025: 6.8 – 13.0 ARI per 1,000
- Week 50, 2025: 6.7 – 14.5 ARI per 1,000
Note the high uncertainty—highlighted by the wide predictive intervals, especially at longer horizons—linked to the early stage of the season and the limited amount of available data. A gradual increase in ARI incidence is also expected at the regional level in the coming weeks.
Consistent with last week’s forecasts, there is a significant increase in ARI activity associated with influenza expected over the coming weeks (particularly type A, see top-right chart). The rapid growth in influenza-attributable ARI activity stems from the fact that the ARI indicator reflects the combined circulation of multiple respiratory viruses. In recent weeks, viruses such as SARS-CoV-2, RSV, and rhinovirus — which normally contribute substantially to the overall ARI burden — have shown stable or declining circulation, as reported by the virological surveillance system RespiVirNet. This means that the share of ARI not due to influenza is relatively stable. In this context, the rise in influenza virus positivity stands out more clearly and results in a faster increase in influenza-attributable ARI activity.
For more details, explore the results on the dashboard.
We thank the teams participating in the 2025/26 season:
- Center for Computational Social Science and Human Dynamics – Trento
- CoMuNe Lab, University of Padua
- Networks in Disease Ecology Lab, University of Padua
- Queen Mary University of London
- Complex Systems Laboratory, Department of Electronics and Telecommunications, Politecnico di Torino
- ISI Foundation
The new Influcast forecasting season is starting!
This year brings important updates regarding the forecasting targets. To align with the changes introduced in the RespiVirNet surveillance system, Influcast will provide short-term forecasts of acute respiratory infections (ARI) instead of influenza-like illness (ILI), starting from the 2025/26 season. For more information on the updated case definition used in surveillance, please visit the official RespiVirNet website.
Starting this season, this update bulletin will also include forecasts for the new targets integrating virological information: ARI+ (Influenza A) and ARI+ (Influenza B). These targets estimate the incidence of ARI attributable to influenza viruses of type A and B. For more information on how ARI+ is calculated, visit the dedicated page.
-
Ensemble forecasts for week 45 indicate a gradual increase in ARI incidence nationwide over the coming weeks. Specifically, the estimated ranges are:
- Week 46, 2025: 7.1 – 9.5 ARI per 1,000
- Week 47, 2025: 6.8 – 11.0 ARI per 1,000
- Week 48, 2025: 6.6 – 13.0 ARI per 1,000
- Week 49, 2025: 6.3 – 15.2 ARI per 1,000
- A gradual increase in ARI incidence is also expected at the regional level. For more details on individual regions, explore the results on the dashboard.
- A significant rise in ARI activity associated with influenza (particularly type A, see the top-right plot) suggests that, even though ARI data do not yet show a clear upward trend, influenza virus activity is expected to increase substantially in the coming weeks. It is important to note that ARI includes multiple pathogens, which may mask individual viral dynamics, whereas ARI+ allows for a clearer view of specific influenza virus circulation.
-
We thank the teams participating in the 2025/26 season:
- Center for Computational Social Science and Human Dynamics – Trento
- CoMuNe Lab, University of Padova
- Networks in Disease Ecology Lab, University of Padova
- Queen Mary University of London
- Complex Systems Laboratory, Department of Electronics and Telecommunications, Politecnico di Torino
- ISI Foundation