

Influcast is the first Italian hub for epidemiological forecasts that aggregates estimates produced by different research teams about the future trends of acute respiratory infections at both national and regional levels. The project is coordinated and maintained by the ISI Foundation in Turin.
How does Influcast work?
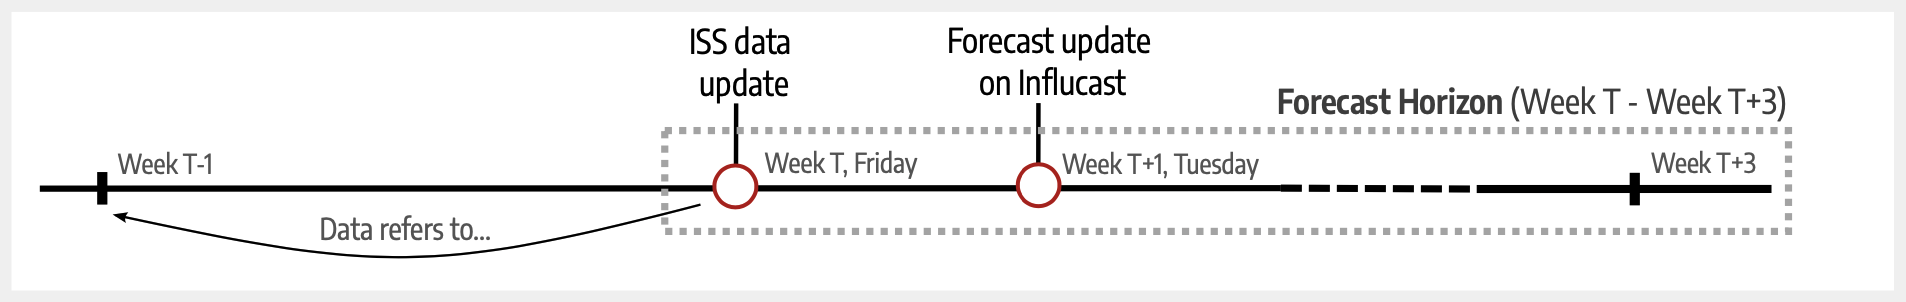
During the influenza season, participating teams weekly submit probabilistic forecasts from their models regarding acute respiratory infections (ARI) incidence for the upcoming four weeks. Specifically, Influcast considers the number of reported cases from the network of sentinel doctors across Italy as the target variable for the forecasts. This data is communicated every Friday by the Italian National Institute of Health (ISS) through the RespiVirNet bulletin. It is important to emphasise that this number is influenced not only by influenza viruses but also by other respiratory viruses, such as SARS-CoV-2 and Rhinovirus. The incidence data published by the ISS is for the previous week, while the update of the Influcast platform occurs on the following Wednesday, allowing the teams some time to process the new data and calibrate their models. Consequently, the forecasts published on Influcast on Wednesdays pertain to the previous week (for which there isn't yet a consolidated public data), the current week, and the two subsequent weeks.
The forecasts from individual models are displayed alongside historical data, enabling the perspective of each model on the short-term evolution of ARI incidence in Italy and its regions to be captured. Finally, the forecasts from each model are combined to produce an ensemble prediction.
What does Influcast forecast?
Currently, Influcast supports two forecasting targets.
Forecasting Target: ARI incidence
The ARI incidence forecasting target represents the weekly incidence of acute respiratory infections (ARI) in Italy, including its regions and autonomous provinces. The ARI incidence is calculated as the number of cases reported by the network of sentinel physicians across Italy per 1,000 patients. This is the primary target of Influcast and is updated weekly by the Italian National Institute of Health (Istituto Superiore di Sanità) through the epidemiological bulletin of the integrated surveillance system RespiVirNet.
Forecasting Target: ARI+incidence
The ARI+incidence forecasting target represents the weekly incidence of acute respiratory infections per 1,000 patients attributable to influenza viruses (types A and B). Specifically, it is calculated separately for type A and B influenza using the following formula:
$ARI_+(InfluenzaA) = ARI \times \frac{positives_{Flu A}}{total \ positives}$
Where $ARI$ is the weekly ARI incidence, $positives_{Flu A}$ is the number of samples testing positive for type A influenza viruses, and $total \ positives$ is the total number of samples testing positive for respiratory viruses. Similarly, $ARI_+(InfluenzaB)$ can be calculated. Information on positive samples is provided weekly through the virological bulletin of the integrated surveillance system RespiVirNet. More details on the calculation of forecasting targets can be found here.
What is a "probabilistic forecast"?
In Influcast, forecasts are presented in the form of prediction intervals rather than point values. To understand the difference, consider the following examples:
- Point forecast: "Next week, the ARI incidence will be 23 cases per thousand individuals."
- Probabilistic forecast: "Next week, with a 95% probability, the ARI incidence will range between 18 and 25 cases per thousand individuals."
In the first example, the point forecast refers to a specific future value with no associated uncertainty. The probabilistic forecast, instead of a single value, has three fundamental elements: i) a confidence level (95% in the example), ii) a lower limit value (18 in the example), and iii) an upper limit value (25 in the example). In this case, the model's prediction is to be interpreted as follows: the actual incidence value for the next week will fall within the interval defined by the lower and upper limits with a certain level of confidence.
Probabilistic forecasts offer significant advantages over a point forecast. Epidemics depend on numerous factors such as human behavior and environmental factors, contributing to their uncertainty. A point value is therefore insufficient to effectively and comprehensively communicate this uncertainty.
On the Influcast platform, it's possible to select three different confidence levels: 50%, 90%, and 95%. By selecting, for instance, 90%, users can visualize the cone of uncertainty within which, according to the model under consideration, the actual incidence value for future weeks will lie with 90% probability.
What is an "ensemble forecast"?
An ensemble forecast is a technique that combines predictions from different models in order to provide a more comprehensive and robust view of the potential future development of a complex system, such as epidemiological dynamics. In complex systems, there are multiple factors and interactions that can influence future trends. The ensemble approach incorporates various models, each of which represents a possible representation of the system under study. This approach is considered more robust than relying solely on the assumptions and hypotheses of a single model.
How do I interpret Influcast visualizations?
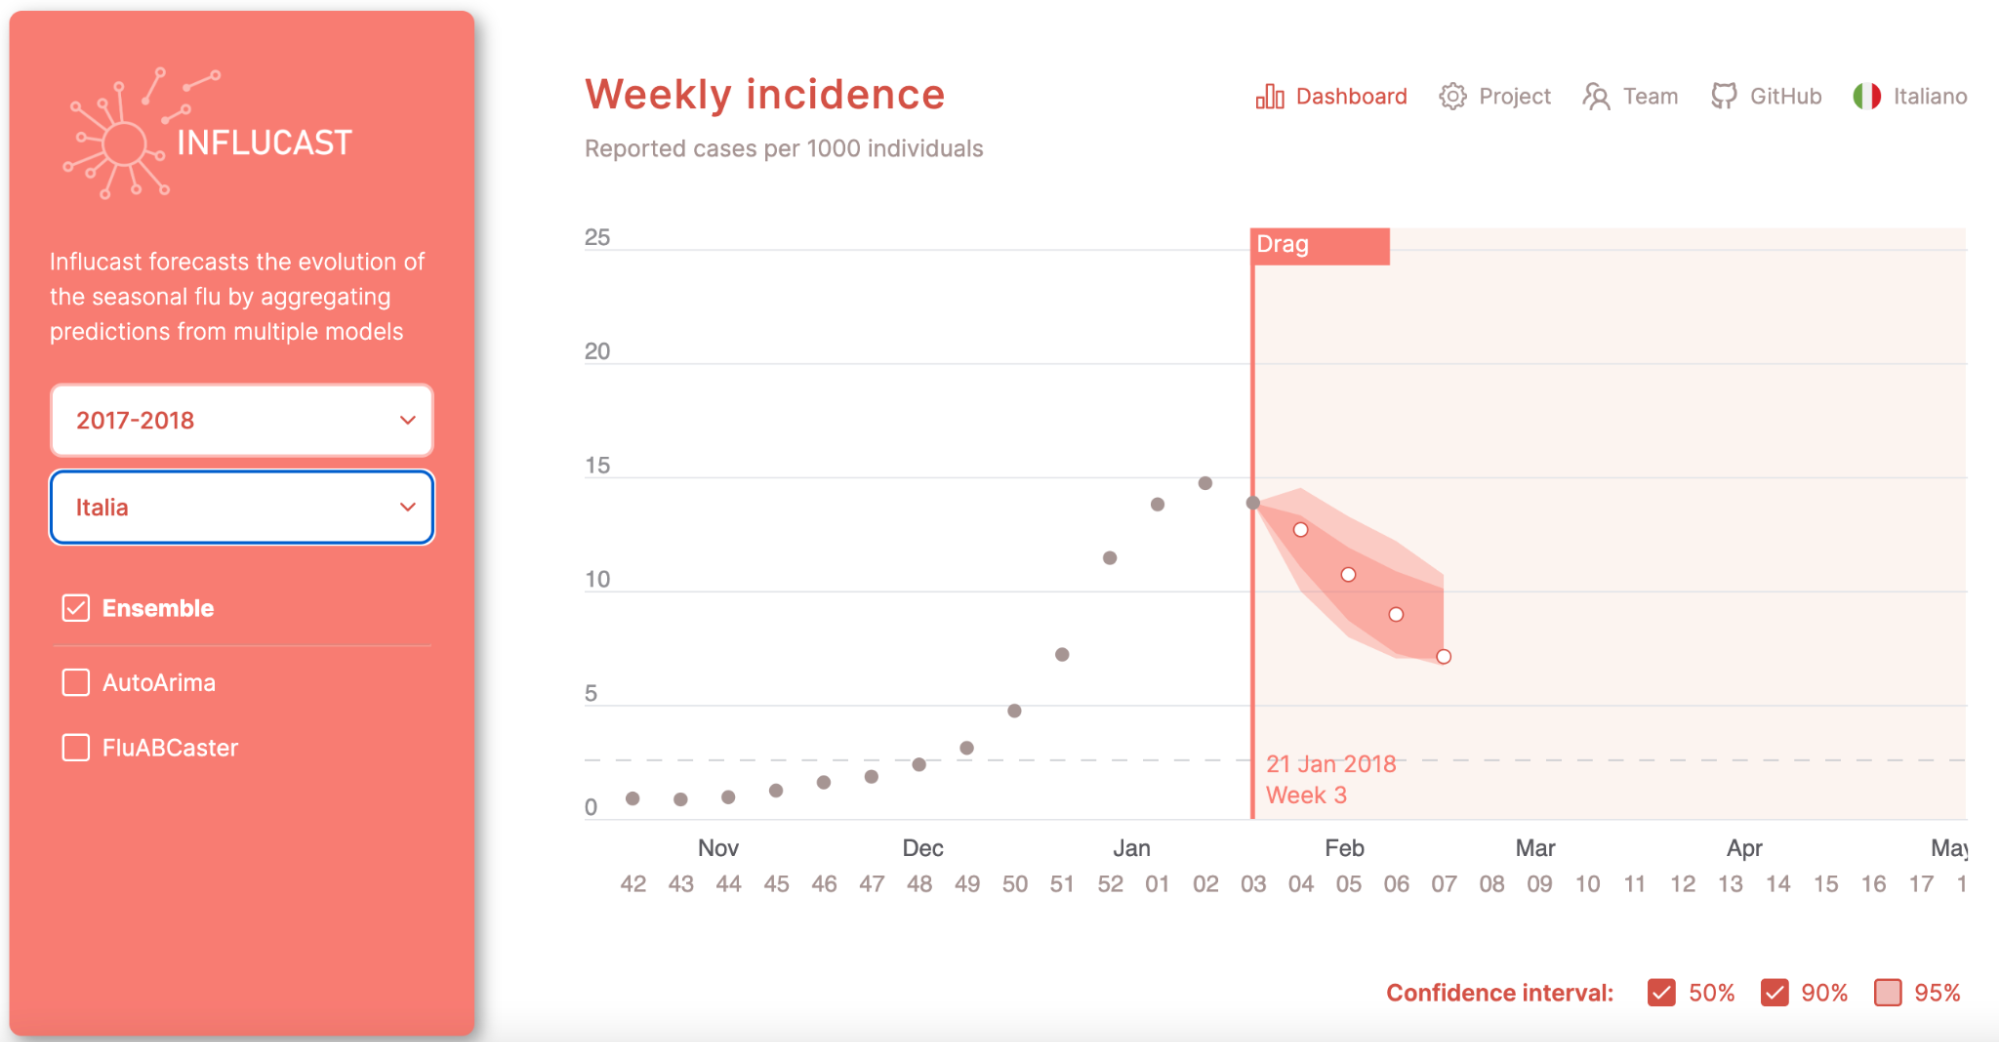
The web interface of Influcast allows users to examine both individual model forecasts and ensemble outputs. Forecasts from each model for the upcoming four weeks are represented using confidence intervals. Default levels include 90% and 50%, but users can select a specific prediction interval through the menu located in the bottom right corner of the graph.
By default, the most recent forecasts are displayed, but users can also view forecasts from previous weeks by dragging a vertical bar on the graph. The blank points represent historical data that were not available at the time of model calibration. This approach visually enables users to assess the predictive ability of each model, specifically to check if the actual data fell within the estimated prediction intervals.
Through the menu on the left, users can choose the geographic unit of interest, either Italy or one of its regions, and the specific desired influenza season. Additionally, users can view predictions from one or more models by selecting them from the menu located in the bottom left corner.
Why is forecasting influenza important?
Every year, acute respiratory infections syndromes have a significant impact on public health in Italy and worldwide, leading to a high number of infections in the population and causing a considerable number of hospitalizations and deaths, especially in vulnerable groups such as the elderly, children, and individuals with pre-existing medical conditions. The rapid spread of respiratory viruses responsible for acute respiratory infections syndromes can overwhelm healthcare services and negatively impact economic productivity. Understanding transmission patterns, developing appropriate and adaptable vaccination strategies, and providing timely information to health authorities and the population are essential elements for mitigating these negative effects on the nation's health and society as a whole.